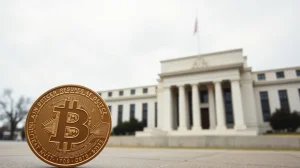
Bitcoin Bear Market 2026: Two On-Chain Signals Suggest the Bottom May Be In
Bitcoin’s price has spent most of 2026 grinding lower, but data from the blockchain is telling a different story beneath the surface. Two specific on-chain signals, tracked by analysts on CryptoQuant, suggest that the selling pressure that has defined this bear market may be exhausting itself, and that the bottom could already be in place.
The Trend Line That Broke
The first signal comes from the Supply in Profit metric, which tracks how many Bitcoin coins are currently worth more than when they last moved. Because the total supply of Bitcoin increases over time, this metric naturally trends upward across cycles. Analysts have used a rising trend line through the prior bear market bottoms in 2018 and 2022 as a floor.
Also read: Strategy Sells $467M in MSTR Shares, Holds Bitcoin Steady as Cash Reserve Reaches $3B
According to CryptoQuant contributor CW8900, that floor has now broken. The current reading sits at 10.2 million BTC, a low not seen at any point in this cycle. CW8900 described the current condition as “the strongest downward pressure in Bitcoin’s history,” while also noting that whales are absorbing the sell-side at record strength. The interpretation being floated is that experienced buyers are stepping in precisely where newer holders are exiting.
OG Sellers Have Gone Quiet
The second signal involves the behavior of the oldest Bitcoin holders. CryptoQuant analyst Darkfost tracked data from investors who have held BTC for more than five years. When those wallets move their coins, it is usually to sell.
Also read: Metaplanet Launches Regulated Securities Arm After Completing Siiibo Acquisition
This cycle saw three distinct peaks in selling from this cohort: around May 2024 (3,860 BTC on a 90-day average), February 2025 (about 3,200 BTC), and a later peak at 2,360 BTC. On individual days, the raw count of coins moved exceeded 10,000, 30,000, and on the worst day, 142,000 BTC in a single session.
Today, that 90-day average has dropped to 962 BTC, its lowest reading since November 2024. According to Darkfost, the most expensive Bitcoin this cohort could have ever paid was around $63,200, which is close to where the market is currently trading. At that price, they are choosing to hold.
What the Data Does Not Say
A quiet OG cohort and a broken trend line do not confirm a bottom. They are conditions that have historically accompanied bottoms, not guarantees. The difference matters.
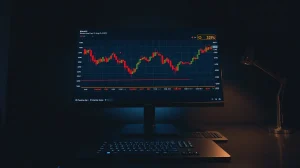
Other data points paint a more cautious picture. Crypto liquidations data published on June 23 showed $404 million in forced closures, with short positions absorbing most of the damage. Short-term holder SOPR was sitting at 0.998239 as of June 21, just below breakeven, meaning recent buyers are not in profit. Bitcoin has also been holding its 200-week moving average, with traders watching a $68,000 to $70,000 liquidity zone as the next major resistance. That level has not been reclaimed.
The Tension in the Numbers
The price looks like a bear market. The behavior of the oldest wallets looks like accumulation. Those two things cannot both be fully right at once. One of them is going to turn out to have been early.
OG holders have been through 2018. They sat through $3,200. The ones who are still around know what a bottom feels like from the inside, which is probably why they stopped selling when they did. Or at least that is what the data says they did. The 90-day average from the OG cohort: 962 BTC.
Frequently Asked Questions
What is the Bitcoin Supply in Profit metric?
Supply in Profit tracks the total number of Bitcoin coins that are currently worth more than when they last moved on the blockchain. A low reading indicates that a large portion of holders are at a loss, a condition often seen near market bottoms.
Why are OG Bitcoin holders going quiet a bullish signal?
OG holders, those who have held Bitcoin for over five years, are typically experienced investors who sell near market tops. When they stop selling, it suggests they see current prices as undervalued and are choosing to hold, reducing sell pressure.
Does a broken trend line in Supply in Profit guarantee a bottom?
No. While the metric breaking below its cycle trend line has historically coincided with bear market bottoms, it is not a guarantee. It is a condition that has accompanied bottoms, not a predictive signal in itself.