

DEXE Token Crashes to $1.90, Then Surges Over 100% in Single Trading Session
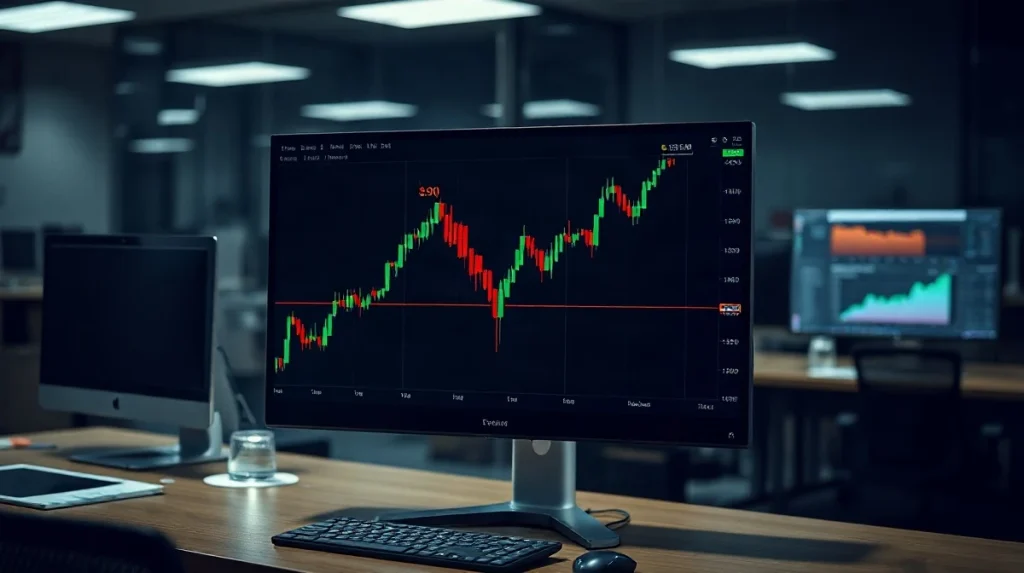
DEXE, the governance token of the DeXe protocol, plunged to roughly $1.90 on July 26, 2026, before staging an intraday reversal that pushed its price above $5 — a recovery of more than 100% from the session low. The move came just three days after the token had fallen from a peak of $48.89, following the movement of millions of dollars in project-linked tokens to Binance.
On-Chain Wallets Moved $6.5M Hours Before the Drop
The sharp decline on July 22 was preceded by suspicious on-chain activity. Two Gnosis Safe multisig wallets — a structure commonly used by project treasuries and teams — sent a combined 624,999 DEXE to Binance. According to data from Arkham Intelligence, one wallet moved 371,309 tokens worth roughly $3.9 million, while a second transferred 253,690 DEXE valued at approximately $2.66 million. The tokens were sent to an intermediate wallet about 14 hours before the crash, then forwarded to Binance deposit addresses. The second wallet’s balance dropped to zero on the day of the crash.
Also read: Rain Protocol Completes First DAO Settlement, Permanently Burns 7.4 Billion $RAIN
Santiment’s on-chain desk had flagged elevated selloff risk for DEXE a full day before the crash, citing large token volumes moving onto exchanges. No hack, exploit, or smart contract issue has been reported, and the DeXe team has not publicly addressed the transfers.
Technical Reversal Signals a Potential Base
Chart analysts identified a falling wedge pattern on DEXE heading into the week — a structure where price grinds lower between converging trendlines, typically resolving upward. The sharp reversal from $1.90 appears to confirm that breakout. On lower timeframes, the 9-period exponential moving average (EMA-9) crossed back above price, and every pullback since has held above that level — a textbook short-term trend flip.
Also read: Morpho Whale Accumulation Rises While Price Stays Flat — What On-Chain Data Shows
The Relative Strength Index (RSI) on the 1-hour chart climbed from deep oversold territory below 20 to 73 during the sharpest leg of the rally, before cooling into the mid-60s. Momentum appears broad-based rather than a single-candle anomaly.
The next significant resistance zone lies between $32 and $40, a range where DEXE consolidated for a full week before the July 22 crash. Old support often becomes resistance on the way back up, and that zone remains far above current levels.
Elliott Wave Structure Suggests Caution
From a wave-analysis perspective, the move off the February low resembled a textbook impulse through wave three, with an extended third wave carrying the bulk of the distance. Wave four unfolded as a week-long sideways chop between $32 and $40 from July 14 to July 21. Instead of a fifth-wave push to a marginal high, price broke down out of that range on July 22 and fell continuously into the $1.90 low.
The bounce since that low has the shape of a B-wave inside a larger correction, not the start of a new uptrend. If that count holds, a C-wave leg lower remains possible before the structure fully resolves, even with today’s strong recovery.
What This Means for Traders
The speed and magnitude of DEXE’s crash and recovery highlight the extreme volatility that can accompany thinly traded governance tokens. While the technical bounce is sharp, the underlying on-chain signals — project-linked wallets moving tokens to exchanges just before a major sell-off — raise questions about insider activity and token distribution. The DeXe team’s silence on the transfers adds to the uncertainty.
For anyone who bought near the $48.89 peak, the intraday recovery to $5 offers little relief. The token remains far below its recent highs, and the emission schedule and governance structure of DEXE remain opaque. Today’s bounce, however dramatic, does not erase those structural risks.