Chainlink Price Analysis: Key Signals That Could End Its Stubborn Consolidation

For over 18 months, the price of Chainlink’s LINK token has moved within a defined range, testing the patience of investors. As of April 2026, this prolonged consolidation phase presents a critical juncture. Technical patterns, on-chain metrics, and shifting fundamentals now suggest a potential resolution may be near. This analysis examines the evidence for a breakout.
Chainlink’s Price Stasis: A Historical Context
Chainlink’s LINK token entered a period of sideways trading in late 2024. According to data from CoinMarketCap, the asset has largely oscillated between a support level near $12.50 and a resistance ceiling around $18.75 since November of that year. This represents one of the longest consolidation phases in the token’s history, contrasting sharply with its volatile past. For context, LINK experienced a dramatic bull run in 2021, climbing to an all-time high near $53. The subsequent bear market brought a steep correction. The current stasis, therefore, can be viewed as a basing period after that significant downturn. Market analysts often interpret such extended ranges as a period of accumulation or distribution before a decisive price move.
Also read: NIGHT Price Stays Under Pressure Despite Midnight’s Token Terminal Partnership
Technical Indicators Paint a Mixed Picture
Standard chart analysis provides conflicting signals. The 200-day moving average has acted as a dynamic resistance level for most of 2025 and early 2026. Each rally attempt has been capped near this key trend line. However, the 50-day moving average has begun to flatten, suggesting selling pressure may be easing. Volume data tells a more nuanced story. Trading volume has declined significantly during this period, a classic hallmark of consolidation. But recent weeks have shown sporadic volume spikes on upward price movements, which some technicians view as early accumulation. The Relative Strength Index (RSI) has consistently bounced between 40 and 60, avoiding both oversold and overbought extremes. This indicates a market in equilibrium, lacking a strong directional bias from momentum traders.
On-Chain Data Reveals Holder Conviction
Beyond price charts, blockchain data offers insights into investor behavior. According to analytics firm Glassnode, the number of LINK addresses holding tokens for more than one year has reached a record high. This metric, often called ‘HODLer’ count, has climbed steadily throughout the consolidation. Simultaneously, the percentage of LINK supply held on centralized exchanges has fallen to multi-year lows. Data shows this figure dropped below 15% in March 2026. This trend suggests long-term investors are moving tokens into private wallets, reducing immediate sell-side pressure. What this means for investors is a potential supply shock if demand suddenly increases. Fewer tokens available for quick sale on exchanges can amplify upward price moves.
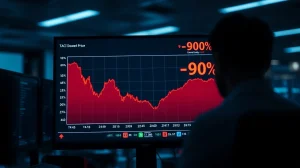
Also read: Telegram-Linked TAC Token Crashes 90% in 15 Minutes: What Happened?
Fundamental Catalysts Waiting in the Wings
Chainlink’s core business—providing decentralized oracle networks—continues to expand irrespective of its token price. The protocol’s adoption in traditional finance, or TradFi, represents a significant development. In February 2026, banking consortiums in Asia and Europe began pilot programs using Chainlink’s Cross-Chain Interoperability Protocol (CCIP) for cross-border asset transfers. This real-world utility could drive new demand for LINK tokens, which are staked to secure these networks. Furthermore, the growth of decentralized finance (DeFi) and blockchain-based real-world asset (RWA) platforms continues to create a steady, underlying demand for reliable data feeds. Chainlink dominates this sector, with its oracle networks securing tens of billions in value. Industry watchers note that revenue generated from these services, while not directly tied to token price, strengthens the network’s overall value proposition.
Comparing Market Structure to Previous Cycles
Historical analysis provides a useful framework. Chainlink has experienced similar prolonged consolidations before major moves. For instance, in 2020, LINK traded in a tight range for approximately eight months before beginning a parabolic ascent. The current phase is longer, but the market structure shows parallels: declining exchange balances, high long-term holder concentration, and quiet accumulation. The broader cryptocurrency market cycle also plays a role. Bitcoin and Ethereum broke out to new highs in late 2025. Altcoins like Chainlink often follow with a lag. This could signal that LINK is in the final stages of basing before catching up to the broader market trend. The implication is that patience may be rewarded, but timing remains uncertain.
Potential Scenarios and Key Levels to Watch
Two primary outcomes exist. A bullish breakout requires a sustained weekly close above the $18.75 resistance level on high volume. Such a move could trigger a rapid revaluation, with initial targets near $25 based on the height of the consolidation range. Conversely, a breakdown below the $12.50 support, which has held for over 70 weeks, would be a bearish development. This could see LINK retest lower support zones near $10 or even $8. Market participants are closely monitoring these boundaries. Several factors could act as catalysts:
- Macroeconomic shifts: Changes in interest rate policy or institutional crypto adoption.
- Protocol upgrades: Successful implementation of Chainlink’s staking v0.2 and new service launches.
- Broader crypto sentiment: A sustained ‘altcoin season’ driving capital into major projects like Chainlink.
The coming weeks will likely determine the direction. Analysts emphasize that false breakouts are common after such long periods of compression. A clean, high-conviction move is needed to confirm a new trend.
Conclusion
The Chainlink price consolidation represents a tense equilibrium between accumulating long-term believers and exhausted short-term traders. Technical analysis shows a market coiled for a move, while on-chain data reveals strong holder conviction. The fundamental case for Chainlink’s oracle services continues to grow, building a foundation for future value. For the LINK token, a breakout from this prolonged phase appears increasingly probable. The direction of that move will depend on whether buyers or sellers finally muster the strength to overpower the other at key support or resistance levels. Monitoring volume and on-chain flows will provide the earliest signals for the next major Chainlink price trend.
FAQs
Q1: How long has Chainlink’s LINK token been in this consolidation phase?
LINK has been trading primarily between $12.50 and $18.75 since late 2024, marking one of the longest sideways periods in its history, extending over 18 months as of April 2026.
Q2: What does a ‘breakout’ mean in technical analysis?
A breakout occurs when an asset’s price moves decisively above a well-defined resistance level or below a key support level on significant volume, indicating a potential shift in market structure and the start of a new trend.
Q3: Why is the amount of LINK on exchanges important?
A lower supply on exchanges suggests tokens are being moved to long-term storage, reducing readily available sell pressure. This can make the price more volatile to the upside if new buying demand emerges.
Q4: What are the main fundamental drivers for Chainlink beyond speculation?
Demand is driven by the need for its decentralized oracle services across DeFi, TradFi pilot programs, and real-world asset tokenization. LINK tokens are used to stake and secure these data networks.
Q5: What is a key signal that the consolidation is ending?
A sustained weekly close above $18.75 or below $12.50 with a substantial increase in trading volume would be a primary technical signal that the consolidation phase has concluded.