Ontology Gas (ONG) Price Confronts Major Resistance—Can It Spark a 150% Rally?

The price of Ontology Gas (ONG) is testing a significant technical barrier this week. Trading data shows the token hovering near $0.45, a level that has repeatedly capped gains since late 2025. This resistance test comes amid mixed signals for the broader crypto market and specific developments within the Ontology ecosystem. Market analysts are scrutinizing the charts to determine if the current setup could lead to a substantial price move.
ONG Price Action at a Critical Juncture
According to data from CoinMarketCap, ONG’s price reached a local high of $0.452 on April 2, 2026, before pulling back slightly. This price zone represents a confluence of resistance factors. The $0.45 to $0.48 range acted as strong support throughout much of 2024 before breaking down in early 2025. Now, it has flipped to become a ceiling. A clean break above this area is seen by many chart watchers as the first major step needed for any sustained recovery.
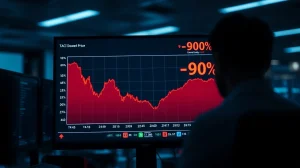
Also read: Telegram-Linked TAC Token Crashes 90% in 15 Minutes: What Happened?
Volume analysis provides context. Trading volume for ONG has increased by approximately 35% over the past seven days, according to exchange data compiled by CryptoCompare. This suggests growing interest. However, the volume on up days has not yet decisively overpowered the volume on down days. This is a key metric technicians monitor for confirmation of a breakout.
Technical Patterns and the 150% Scenario
The mention of a 150% rebound originates from a specific chart pattern. On the weekly timeframe, some analysts observe a potential inverse head and shoulders formation. This pattern, if confirmed, has a measured move target derived from the depth of the “head” to the “neckline.” For ONG, this calculation points toward a target near $1.10, which would represent an increase of roughly 150% from current levels around $0.44.
Also read: XRP Scarcity Index on Binance Hits Highest Level Since Mid-2024, So Where Did the Coins Go?
But confirmation is everything. “Patterns are probabilistic, not prophetic,” notes a report from analytics firm IntoTheBlock. “For ONG, the pattern’s validity hinges on a weekly close above $0.48 with strong volume. Without that, it remains just a drawing on a chart.” The firm’s data also shows that over 60% of ONG addresses are currently “out of the money,” meaning they bought at higher prices. This could create selling pressure as the price approaches their break-even points.
Network Fundamentals and Utility Demand
ONG is not merely a speculative asset; it is the utility token of the Ontology blockchain. It is used to pay for network services like smart contract deployment, transaction fees, and staking. Therefore, its price is theoretically linked to network usage. Data from Ontology’s own explorer shows a steady increase in daily transactions, averaging around 15% higher in Q1 2026 compared to Q4 2025.
This rise in activity creates a fundamental demand sink for ONG. Developers and users must acquire the token to operate on the chain. However, the relationship between usage and price is not always immediate. “Utility demand provides a long-term price floor,” explains a market commentary from Binance Research. “In the short term, macroeconomic factors and broader crypto sentiment often dominate price action.”
Broader Market Context and Sentiment
ONG does not trade in a vacuum. Its performance is heavily influenced by Bitcoin and general altcoin market sentiment. In recent weeks, Bitcoin has struggled to maintain momentum above key levels, creating headwinds for all altcoins. The Crypto Fear & Greed Index, a popular sentiment gauge, has been oscillating in the “Neutral” zone, reflecting market uncertainty.
This suggests that for ONG to stage a major independent rally, it would likely need a catalyst specific to its ecosystem. Potential catalysts could include a major new partnership announcement, a significant upgrade to the Ontology protocol, or a surge in adoption of its decentralized identity solutions. Without such a driver, ONG’s price may remain tethered to the broader market’s direction.
Historical Performance and Investor Psychology
ONG’s price history is marked by high volatility. It reached an all-time high near $10 in early 2018 before a prolonged bear market. Since then, it has established lower highs. This long-term chart structure influences investor psychology. Long-term holders may see current levels as an accumulation zone, while short-term traders are focused on the immediate resistance.
On-chain data reveals some accumulation. The number of addresses holding between 10,000 and 100,000 ONG has grown by 8% in the last quarter, according to Santiment. This cohort is often considered “smart money” or committed investors. Conversely, exchange inflows—a potential precursor to selling—have remained relatively stable, showing no signs of a major sell-off at current prices.
Risk Factors and Downside Scenarios
While the rebound setup is compelling, risks are evident. The primary risk is a rejection at the $0.45-$0.48 resistance zone. If the price fails to break through and rolls over, the next major support level sits around $0.35. A break below that could invalidate the bullish pattern entirely and lead to a retest of the 2025 lows near $0.28.
External risks include regulatory developments, unexpected shifts in monetary policy affecting liquidity, and black swan events in the broader financial system. For a mid-cap altcoin like ONG, these factors can cause disproportionate volatility. Investors should size positions accordingly and avoid over-use, especially around key technical levels.
Conclusion
The Ontology Gas price is at a technical inflection point. The setup for a significant rebound exists on the charts, with a pattern pointing toward a 150% move if key resistance is conquered. However, this potential is balanced by the need for confirmed breakout volume, supportive broader market conditions, and sustained network demand. The coming weeks will be decisive. A weekly close above $0.48 would shift the technical narrative strongly in the bulls’ favor, while failure here could extend the consolidation phase. For now, the ONG price remains in a tense standoff with a key resistance level.
FAQs
Q1: What is Ontology Gas (ONG) used for?
ONG is the utility token of the Ontology blockchain. It is required to pay for transaction fees, deploy smart contracts, and participate in staking on the network. This creates inherent demand linked to ecosystem usage.
Q2: What does “testing resistance” mean in trading?
In technical analysis, resistance is a price level where selling pressure has historically been strong enough to prevent further price increases. “Testing resistance” means the price has approached this level again, and traders are watching to see if it will break through or be rejected.
Q3: How is the 150% rebound target calculated?
The target is derived from a technical chart pattern, often by measuring the height of a formation and projecting that distance upward from a breakout point. It is a theoretical target, not a guarantee, and requires the pattern to first confirm with a valid breakout.
Q4: Does increased network activity guarantee a higher ONG price?
Not immediately. While increased transactions create more utility demand for ONG, price is influenced by many factors, including speculation, market sentiment, and liquidity. Utility demand can provide a long-term foundation, but short-term price swings are often driven by other forces.
Q5: What are the main risks for ONG’s price right now?
The main risks are a failure to break the $0.48 resistance, leading to a pullback; a downturn in the broader cryptocurrency market; and a decrease in network activity or developer interest in the Ontology ecosystem.