
Litecoin Bulls Eye XRP-Style Breakout as LTC Holds Key Support Near $57.75
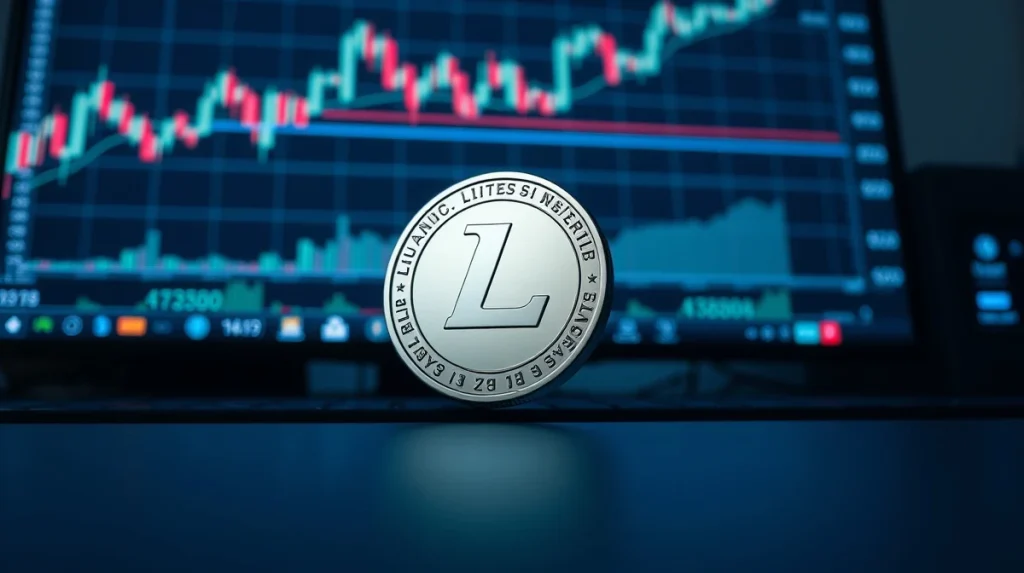
Litecoin is trading near $57.75, drawing comparisons from analysts to XRP’s recent breakout pattern. The cryptocurrency has fallen below major Fibonacci retracement levels but is holding a long-term support zone that bulls believe could trigger a significant upside move.
Technical Setup and Resistance Levels
The immediate resistance to watch is $74.21, a level that traders say would confirm a breakout if reclaimed with volume. A move above that could open the door to a rally toward $750, according to some technical projections based on historical patterns and Fibonacci extensions. However, the current price action remains subdued, with Litecoin struggling to regain momentum after a broader market pullback.
Also read: BNB Chain Reveals New Layer 1 Blockchain for Agentic Trading, Mainnet Set for 2027
Comparison to XRP’s Rally
Analysts point to similarities between Litecoin’s current chart structure and XRP’s setup before its 2023 rally, which saw the token surge after a prolonged consolidation near support. The comparison hinges on both assets showing compressed volatility and low relative strength index (RSI) readings before a breakout. Still, market conditions differ, and Litecoin’s network fundamentals, including hash rate and transaction counts, remain steady but not explosive.
What This Means for Traders
For traders, the key is whether Litecoin can hold above the $55 support zone. A breakdown below that level could invalidate the bullish thesis and lead to further downside toward $48. Conversely, a sustained move above $74.21 with increasing trading volume would strengthen the case for a larger rally. The setup is speculative but not without precedent, as Litecoin has historically seen sharp recoveries after extended periods of low volatility.
Also read: Naver Financial and Dunamu Push Share Swap Deadline to December Amid Regulatory Hurdles
Conclusion
Litecoin’s price action at $57.75 presents a potential turning point. While the XRP-like breakout comparison is drawing attention, the actual outcome depends on broader market sentiment and Litecoin’s ability to clear key resistance. Traders should watch the $74.21 level as a confirmation signal while remaining cautious about downside risks below $55.
FAQs
Q1: Why are traders comparing Litecoin to XRP?
Analysts see similar chart patterns, including prolonged consolidation near support and low volatility, which preceded XRP’s significant rally in 2023.
Q2: What is the key resistance level for Litecoin?
The immediate resistance is $74.21. A break above that level with strong volume could confirm a bullish breakout toward higher targets.
Q3: Is a rally to $750 realistic?
While some technical projections point to $750 based on Fibonacci extensions, such targets are speculative and depend on sustained momentum and favorable market conditions.


