
In this article3 sections
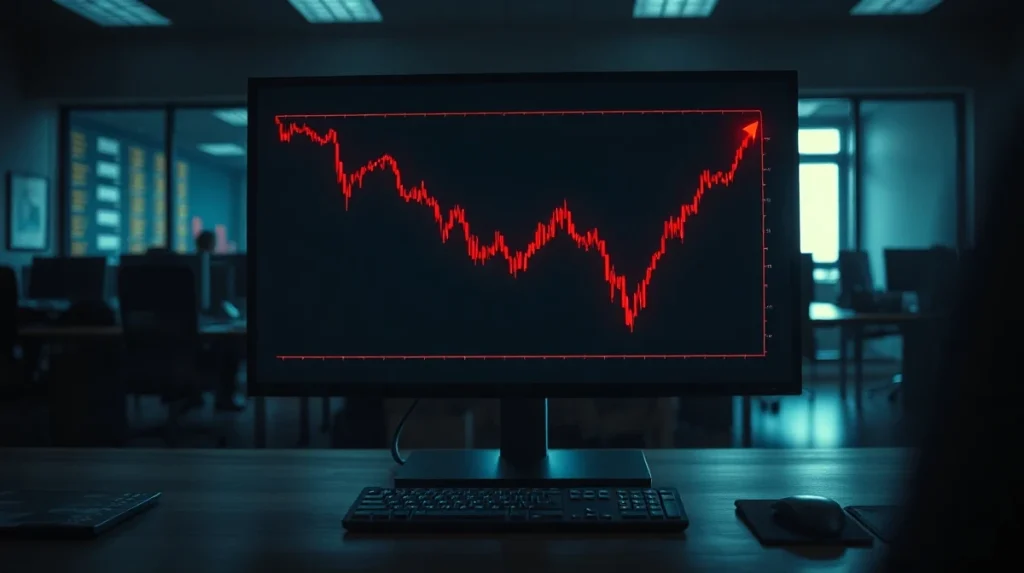
Audiera (BEAT) has emerged as one of the worst-performing cryptocurrencies this week, with its price plunging more than 70% since August 4. The sharp decline has erased most of the gains from a recent speculative rally, leaving the token in a deeply bearish technical position. The sell-off intensified after a token unlock released 21.25 million BEAT tokens into circulation, valued at roughly $67.8 million at the time.
The breakdown accelerated on August 10-11, with BEAT falling toward the $1.00 mark after trading near $3.00 earlier in the week. This rapid move has raised questions about whether the token can find a floor or if further downside is ahead.
 Also readChainlink Price Rally Accelerates: Can LINK Bulls Flip $12 Into Support?
Token Unlock and Tap into Unwinding Fuel the Decline
The correction began in early August when Audiera unlocked 21.25 million tokens, representing approximately 6.9% of the circulating supply. This supply increase came after BEAT had already experienced a sharp speculative run, making the token particularly vulnerable to profit-taking.
The initial 18% drop following the unlock quickly evolved into a more severe sell-off as leveraged positions were unwound. According to market data, the Cumulative Volume Delta (CVD) has turned sharply negative, with net selling pressure reaching roughly $970,000 in recent sessions. This suggests the decline is being driven by aggressive market selling rather than simply a lack of buying interest.
 Also readChainlink Breaks Above $9 — Can Whale Accumulation Push LINK Toward $12?
“The scale of the move indicates that the initial supply shock has been compounded by leveraged position unwinding and panic selling,” noted analysts tracking the token’s price action. “What started as a correction has turned into a much deeper breakdown.”
Technical Analysis: BEAT Loses Key Support Levels
From a technical perspective, BEAT’s chart has deteriorated significantly. The token broke below its ascending trendline, which had been supporting the recovery since April. This loss of the trendline is a clear signal that the short-term structure has shifted in favor of sellers.
The Directional Movement Index (DMI) is also flashing bearish signals, with the negative directional movement gaining strength against the positive indicator. Analysts are watching for a potential bearish crossover, which would confirm the downside trend if it materializes.
The $1.60 level, which previously acted as a support, has now been lost. This level becomes a critical resistance point that BEAT must reclaim to signal any stabilization. Until then, the $0.55–$0.65 zone is the next major downside area to watch.
What the Sell-Off Means for BEAT Holders
For investors holding BEAT, the current situation presents a challenging environment. The token’s failure to hold key support levels suggests that sellers remain firmly in control, and the lack of a convincing reversal signal means the path of least resistance is still lower.
However, it’s worth noting that the $0.55–$0.65 zone could provide a potential stabilization point if buyers step in. This area represents a confluence of previous support levels and could attract bargain hunters looking for a rebound.
The broader market context is also important. While Bitcoin and Ethereum have shown relative stability in recent weeks, altcoins have faced increased volatility. The sell-off in BEAT is not occurring in isolation, but the magnitude of the decline makes it stand out among the top losers.
Looking ahead, the key question is whether BEAT can reclaim the $1.60 level. A successful retest and hold of this level would signal that the worst of the selling may be over. Conversely, a decisive break below $0.55 could open the door to further losses, potentially testing levels not seen since earlier this year.
As with any volatile cryptocurrency, the situation remains fluid. Traders and investors should monitor volume and CVD readings for signs of selling exhaustion. A shift in these indicators, combined with a reclaim of key resistance, would be the first signs of a potential bottom.
Disclaimer: This article is for informational purposes only and does not constitute financial advice. Cryptocurrency markets are highly volatile and uncertain. Always conduct your own research before making investment decisions.
Source: Coinpedia