XRP Short Squeeze Risk Rises as $3.9M in Leveraged Shorts Stack Above $1.15
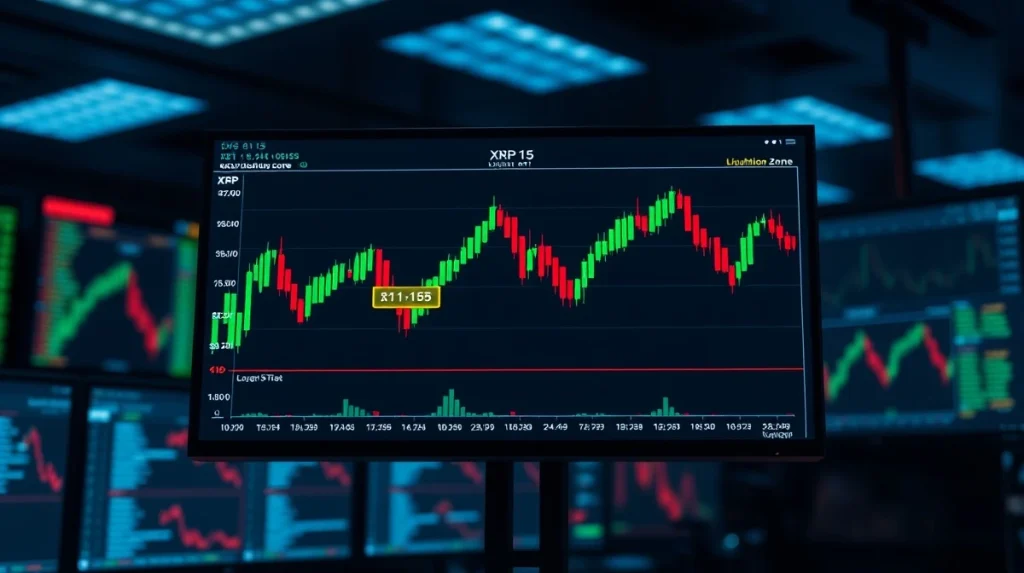
XRP short traders face increasing pressure as on-chain liquidation data reveals more than $3.9 million in cumulative short use stacked above $1.15. The token trades near $1.14 on the daily chart, hovering close to a short-term support zone that could determine the next directional move.
XRP Price Holds Near Key Short-Term Support
XRP traded near $1.14 on the daily chart after losing strength from earlier highs above $3.00 earlier in 2026. The token has formed lower highs through the year, keeping the broader structure under pressure. The $1.10 to $1.15 range now acts as a critical short-term zone for traders. Buyers need to defend this area to prevent another move toward lower support. A daily close below $1.10 would weaken the current setup and place the $1.00 level back in focus. However, steady demand above this zone would support another attempt toward higher resistance.
Also read: Circle Secures New York Trust Charter, Strengthening USDC's Regulatory Standing
Short Liquidation Tap into Builds Above $1.15
Liquidation data shows more than $3.9 million in cumulative short employ stacked above $1.15, meaning many leveraged bearish positions face forced closure if XRP moves above that level. As noted by crypto analyst Xaif Crypto on June 21, 2026, “XRP shorts are sitting exposed right now.” Short squeezes often develop when price moves into crowded liquidation zones, as forced buying from short closures can add speed to an upward move. The current setup places $1.15 as the first level to watch for short-term pressure. A strong daily move above that area would shift focus toward $1.35 and then $1.50.
RSI and MACD Show Mixed Momentum
The 14-day Relative Strength Index (RSI) sits near 40.65, showing weak buyer strength but not extreme oversold conditions. This reading means XRP still has room to recover if buyers regain control. A move above the 50 RSI level would give traders a stronger signal of improving momentum. Until then, sellers still hold an advantage in the broader daily structure.
Also read: Seoul Police Arrest Three in $19 Million Fake XRP Staking Scam
The Moving Average Convergence Divergence (MACD) remains below the zero line, indicating that the larger trend still favors bearish pressure. However, the MACD line sits slightly above the signal line, suggesting early recovery pressure may be forming. For now, XRP remains between short squeeze risk above $1.15 and breakdown risk below $1.10. Traders are watching whether buyers can push price into the short liquidation cluster.
Frequently Asked Questions
What is a short squeeze in crypto trading?
A short squeeze occurs when a rising price forces traders who bet against an asset (short sellers) to buy back the asset to close their positions, which adds more buying pressure and can push the price up further.
Why is the $1.15 level important for XRP?
Data shows over $3.9 million in cumulative short liquidation tap into stacked above $1.15. If XRP breaks above this level, many leveraged short positions could be liquidated, potentially triggering a rapid price increase.
What are XRP’s key support levels right now?
The $1.10 to $1.15 range is a critical short-term support zone. A daily close below $1.10 would weaken the current setup and could bring the $1.00 level back into focus.
How do the RSI and MACD indicators look for XRP?
The 14-day RSI is near 40.65, showing weak buyer strength but not oversold conditions. The MACD remains below zero, indicating bearish pressure, though the MACD line is slightly above the signal line, suggesting early recovery signs.