
XRP Holds $1.36 as Sharpe Ratio Hits One-Year High: What’s Next?
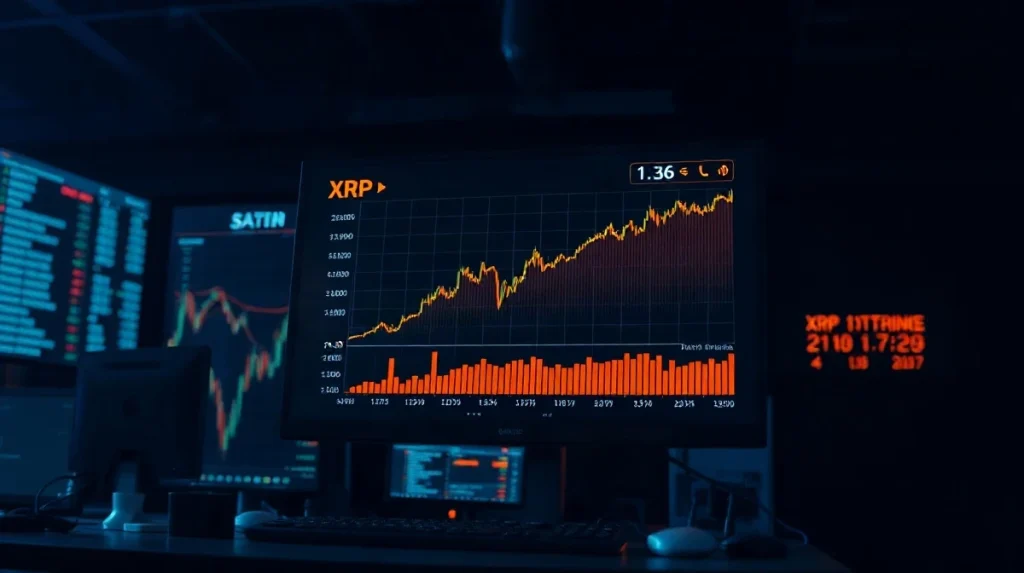
XRP is trading near $1.36 on August 31, 2026, after a sharp recovery from recent lows, with its Binance Sharpe Ratio climbing to 0.207 — the highest level since August 2025. The token has broken above a descending trendline on the daily chart, and traders are now watching whether a sustained push above $1.40 can open the path toward the $2.00 resistance zone.
The recovery comes after XRP spent much of the year in a downtrend, forming a base near the $1.20 support level before a volume-backed breakout. The move has pushed price back above key moving averages around $1.30–$1.35, strengthening the short-term market structure.
Also read: Zcash's New Zakura Common Cuts Private Transaction Time to Under 200 Milliseconds
Sharpe Ratio Signals Improving Risk-Adjusted Performance
The Sharpe Ratio measures return relative to volatility, and the recent rise to 0.207 indicates that XRP’s performance has improved on a risk-adjusted basis. While the indicator is not a standalone bullish signal, its alignment with the price recovery adds weight to the broader improvement in market structure.
According to on-chain data, the ratio has been climbing alongside XRP’s move toward $1.40. This suggests that the recent gains are not merely volatile spikes but are being achieved with relatively lower risk, which could attract institutional and retail investors looking for more stable exposure.
Also read: Dogecoin Buy Signal Flashes as DOGE Approaches Key $0.056 Support Level
The key takeaway is the alignment between price and momentum: XRP is recovering from a prolonged decline while the Sharpe Ratio is simultaneously moving higher. This dual improvement is often seen as a sign of a healthier trend, though traders should remain cautious about overinterpreting a single indicator.
Liquidation Heatmap Puts $1.40 in Focus
The Binance XRP/USDT liquidation heatmap highlights significant liquidity around the current price region and toward $1.38–$1.40. That area could become an important battleground if XRP accelerates higher. A move through concentrated liquidation zones can increase short-term volatility as leveraged positions are closed, potentially adding momentum to an existing breakout.
Above this region, the daily chart shows the more important resistance band around $1.55–$1.60. This remains the level that XRP bulls ultimately need to reclaim to establish a broader bullish reversal. A decisive close above this zone with strong volume could confirm a trend change and bring the $2.00 psychological level into focus.
Can Bulls Reach the $2 Level?
The immediate hurdle is now $1.40. A sustained move above this level would provide confirmation that buyers are attempting to extend the rally toward the $2 level. However, the path is not without risks. A sustained break below $1.30 would weaken the setup, while losing $1.20 would invalidate the bullish thesis.
For context, XRP’s previous attempt to reach $2 came in late 2025, when the token briefly touched $1.98 before facing heavy selling pressure. Since then, the market has seen increased regulatory clarity and growing institutional interest in digital assets, which could provide a more supportive backdrop for a sustained rally.
Traders should also watch broader market conditions, particularly Bitcoin’s performance, as altcoin movements often correlate with BTC’s direction. A strong Bitcoin rally could provide the tailwind XRP needs to break through resistance levels, while a market-wide pullback could stall the recovery.
As always, the cryptocurrency market remains highly volatile, and price predictions are inherently uncertain. Investors should conduct their own research and consider their risk tolerance before making any trading decisions.