Solana Under Pressure as TD Sequential Signals Potential Drop to $90
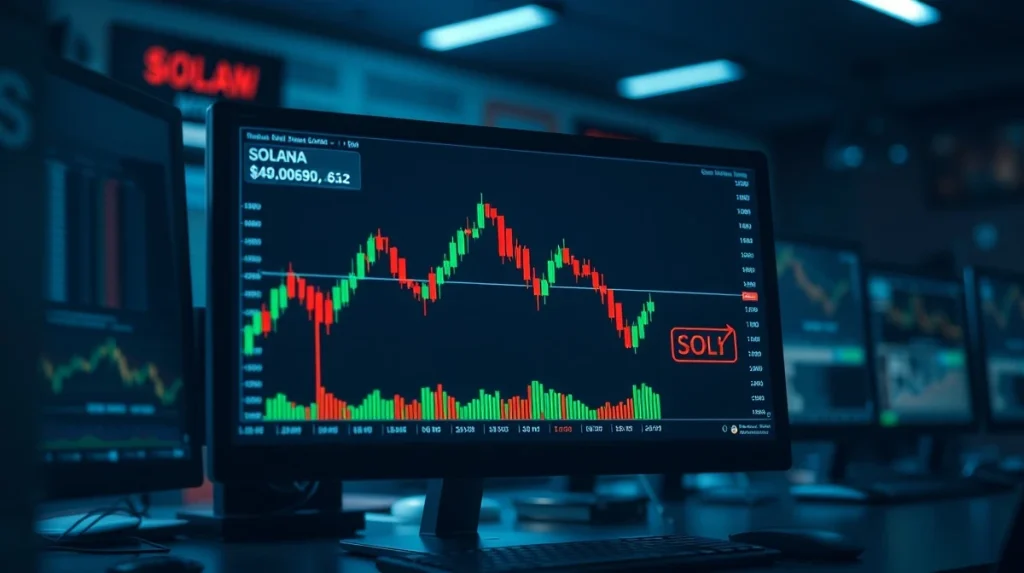
Solana (SOL) is facing renewed selling pressure this week as a widely followed technical indicator suggests the digital asset could be headed toward the $90 support level. The TD Sequential indicator, known for identifying potential trend exhaustion points, has flashed a sell signal on Solana’s daily chart, drawing attention from traders and analysts tracking the altcoin’s price action.
Technical Signal Raises Caution
The TD Sequential, developed by market technician Tom DeMark, is used by many cryptocurrency traders to identify potential price reversals or trend continuations. On Solana’s daily timeframe, the indicator has now triggered a sell signal, which historically has preceded short-term downward moves. As of the latest data, Solana is trading near $95.45, down from recent highs above the psychologically important $100 mark.
Also read: Memecoins See $1.2 Billion Sell-Off on Binance Since Bitcoin’s October 2025 Peak
According to the analysis, the next key level to watch is the $90 support zone. A break below that area could open the door for further losses, especially if broader market sentiment remains cautious. The $113 resistance level continues to cap any upside attempts, reinforcing the current bearish bias in the near term.
Market Context and Broader Implications
The signal comes at a time when the broader cryptocurrency market is experiencing mixed momentum. Bitcoin has been consolidating in a range, while many altcoins, including Solana, have struggled to regain upward traction. Solana, which saw a significant rally earlier in the year driven by ecosystem developments and increased DeFi activity, has since cooled off as profit-taking and macroeconomic uncertainty weigh on risk assets.
Also read: CLARITY Act: Lummis Opens Up on Trump, Ethics, and a Possible Veto
For traders, the TD Sequential signal does not guarantee a drop to $90, but it does increase the probability of a test of that level in the coming sessions. The $90 area has historically acted as both support and resistance, making it a critical zone for determining Solana’s next directional move.
What This Means for Holders
For longer-term holders, the current technical setup may present a period of consolidation rather than a structural breakdown. Solana’s fundamentals remain strong, with ongoing network upgrades and growing adoption in the decentralized finance and NFT sectors. However, short-term volatility is likely to persist as the market digests the latest technical signals and broader macroeconomic data.
Conclusion
Solana’s price action is at a key juncture, with the TD Sequential sell signal adding to the bearish narrative in the near term. While a drop to $90 is possible, the level is expected to attract buying interest if tested. Traders should monitor the $90 support closely, as a breakdown below that level could shift the outlook more decisively bearish. As always, technical indicators are one piece of the puzzle, and market participants should consider broader factors before making trading decisions.
FAQs
Q1: What is the TD Sequential indicator and how does it work?
The TD Sequential is a technical analysis tool developed by Tom DeMark that identifies potential price exhaustion points. It consists of a setup phase (count of consecutive closes higher or lower than four bars earlier) and a countdown phase, helping traders spot possible trend reversals or continuations.
Q2: Is a drop to $90 guaranteed for Solana?
No, technical indicators are probabilistic, not deterministic. The TD Sequential signal increases the likelihood of a move toward $90, but price action depends on many factors including market sentiment, trading volume, and broader economic conditions.
Q3: What is the significance of the $90 support level for Solana?
The $90 level has historically acted as a support and resistance zone. A break below it could lead to further downside, while holding above it may signal that buyers are stepping in. It is a key level for short-term trading strategies.