Bitcoin Price Stalls at $66K as Critical Bearish Signals Emerge
Bitcoin’s price touched $66,000 on Tuesday, March 31, 2026, but failed to hold the level as several key technical indicators turned negative. The brief rally met immediate resistance, sparking concerns among traders about a potential near-term pullback.
Bitcoin Price Action and Immediate Resistance
Data from CoinMarketCap shows Bitcoin (BTC) reached an intraday high of $66,142 during early trading hours. However, the cryptocurrency quickly retreated, trading around $65,400 at the time of writing. This price action occurred within a broader consolidation pattern that has persisted for most of March 2026.
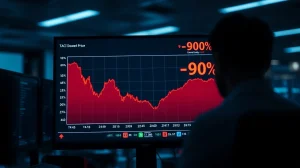
Also read: Telegram-Linked TAC Token Crashes 90% in 15 Minutes: What Happened?
According to tradingview.com charts, the $66,000 to $68,000 zone has acted as a stubborn resistance area since mid-March. Each attempt to break higher has been met with significant selling pressure. Market analysts point to on-chain data as a key factor. Glassnode reported a notable increase in Bitcoin moving to exchanges, often a precursor to selling activity.
Technical Indicators Flash Warning Signs
Several widely watched metrics are now suggesting caution. The Relative Strength Index (RSI) on the daily chart has dipped below 50, moving from overbought territory in late February to neutral. More concerning to some analysts is the moving average convergence divergence (MACD) indicator.
Also read: XRP Scarcity Index on Binance Hits Highest Level Since Mid-2024, So Where Did the Coins Go?
“The daily MACD has shown a bearish crossover,” noted a market update from crypto analytics firm IntoTheBlock. “This is often interpreted as a loss of short-term momentum.” Other signals include:
- Declining Volume: Trading volume for the recent push toward $66K was lower than during the February rally, suggesting weaker buyer conviction.
- Support Test: The price is testing its 50-day simple moving average, a level watched by institutional traders.
- Funding Rates: Perpetual swap funding rates on major exchanges have normalized after being excessively high, reducing the incentive for leveraged long positions.
This combination suggests the bullish momentum from Q1 2026 may be exhausting itself.
Market Sentiment and Macroeconomic Context
The shift in signals comes amid a mixed macroeconomic environment. Recent U.S. inflation data has led markets to scale back expectations for aggressive interest rate cuts by the Federal Reserve in 2026. Higher-for-longer rates typically pressure risk assets like cryptocurrencies.
Furthermore, the Crypto Fear & Greed Index, a sentiment gauge, has moved from “Extreme Greed” in February to a more moderate “Greed” reading. This cooling of sentiment often coincides with consolidation or correction phases. What this means for investors is increased volatility and potentially lower highs in the near term.
On-Chain Data Reveals Holder Behavior
Analysis of blockchain data provides context for the price hesitation. Glassnode’s Net Unrealized Profit/Loss (NUPL) metric, which tracks the overall profit ratio of the network, remains in a “Belief-Denial” phase. This phase has historically preceded both strong rallies and significant corrections, indicating a state of market indecision.
Short-term holder behavior is also telling. Data shows the realized price for short-term holders—the average price at which coins that moved in the last 155 days were acquired—is now around $63,000. With the spot price hovering just above this, the profit margin for recent buyers is thin, making them more likely to sell on any weakness to avoid losses.
Historical Patterns and Potential Scenarios
Bitcoin has experienced similar periods of consolidation after strong quarterly gains. Following the Q1 2023 rally of over 70%, the asset traded sideways for several months before continuing its upward trend. The current technical setup could signal a healthy correction to gather strength for another leg up, or the start of a deeper retracement.
Key support levels to watch, according to technical analysts, are clustered between $60,000 and $62,000. A sustained break below $60,000 would likely invalidate the current bullish market structure for many traders. Conversely, a decisive weekly close above $68,000 could reignite the bullish trend.
Conclusion
The Bitcoin price touching $66,000 highlights ongoing market strength but also reveals clear technical headwinds. The emergence of multiple bearish signals suggests a period of increased caution is warranted. While the long-term outlook for Bitcoin remains debated, the short-term path appears set for volatility as the market digests recent gains and reacts to shifting macro conditions. Traders are now watching key support levels to gauge the next major directional move.
FAQs
Q1: What are the main bearish signals for Bitcoin right now?
The primary signals include a bearish MACD crossover on daily charts, declining trading volume on price advances, and the price testing its 50-day moving average support. On-chain data also shows increased exchange inflows.
Q2: How significant is the $66,000 price level for Bitcoin?
The $66,000 to $68,000 zone has acted as a strong resistance area throughout March 2026. Repeated failure to break through it suggests selling pressure is concentrated at these levels.
Q3: Does this mean the Bitcoin bull market is over?
Not necessarily. Technical pullbacks are common within longer-term uptrends. Many analysts view this as a potential healthy consolidation after a strong Q1 rally, though a break below key support could change that outlook.
Q4: What should investors watch in the coming days?
Key factors include whether Bitcoin can hold above the $63,000-$64,000 support zone, changes in exchange reserve levels, and broader U.S. equity market performance, which often correlates with crypto.
Q5: How does on-chain data support the bearish view?
Metrics like increased movement of coins to exchanges (potential selling supply) and the NUPL indicator shifting from “Extreme Greed” suggest profit-taking is occurring and sentiment is cooling from recent highs.