Bitcoin Options Turn Bearish: Critical Analysis as BTC Flirts with Drop Below $80K

Bitcoin markets experienced significant turbulence this week as bearish sentiment gripped options traders and spot ETF outflows accelerated. The cryptocurrency’s price action near the critical $80,000 support level has triggered the highest fear signals in Bitcoin options markets in over a year, according to data from major derivatives exchanges. This development comes amid broader market uncertainty and shifting institutional dynamics that merit careful examination.
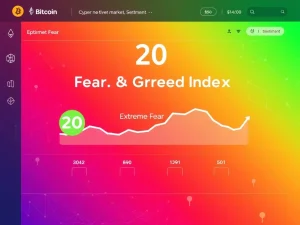
Bitcoin Options Signal Extreme Market Fear
The BTC options delta skew surged to 17% on Friday, reaching its highest point in over twelve months. Typically, in neutral market conditions, put options trade at a premium of 6% or less compared to equivalent call instruments. Current levels indicate extreme fear among traders, which often precedes volatile price movements as market makers hedge against further downside risk. This options market behavior represents a significant shift from the bullish sentiment that dominated cryptocurrency markets throughout early 2025.
Derivatives data reveals approximately $860 million in leveraged long BTC futures positions were liquidated between Thursday and Friday alone. However, aggregate BTC futures open interest actually declined to $46 billion on Thursday, down substantially from $58 billion three months earlier. This reduction in leverage suggests the market may be healthier despite recent volatility, as excessive speculative positions have been systematically purged from the system.
Spot Bitcoin ETF Outflows and Institutional Sentiment
US-listed spot Bitcoin ETFs have recorded $2.7 billion in net outflows since January 16, representing 2.3% of total assets under management. This trend has raised questions about whether institutional demand has temporarily stalled or if investors are rotating into alternative assets. Notably, gold prices dropped 13% from their Wednesday all-time high during the same period, suggesting broader precious metals and store-of-value assets faced similar pressure.
Market analysts point to several contributing factors:
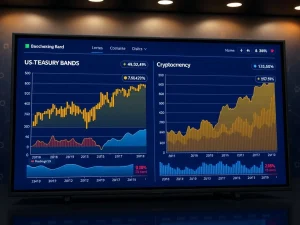
- Macroeconomic conditions: Rising demand for cash and short-term US Treasuries
- Asset rotation: Profit-taking after Bitcoin’s substantial gains in early 2025
- Technical factors: Natural market corrections following extended bullish periods
- Regulatory developments: Ongoing global cryptocurrency policy discussions
Quantum Computing Concerns Add to Market Anxiety
Beyond immediate price action, longer-term security concerns have emerged as a secondary anxiety source for Bitcoin investors. The potential threat posed by quantum computing to blockchain cryptographic methods has gained attention following Coinbase’s formation of an independent advisory board to evaluate these risks. The exchange plans to release public research by early 2027, operating this initiative separately from its core management structure.
This debate intensified after Jefferies removed Bitcoin from its flagship portfolio, citing these long-term security considerations. However, prominent cryptographer and Blockstream co-founder Adam Back predicted no material quantum risk would emerge over the next decade. Back argued that quantum technology remains at a very early developmental stage, and even partial breaks in cryptography would not enable Bitcoin theft due to the network’s layered security architecture.
Asian Market Indicators and Stablecoin Dynamics
Analysts frequently examine stablecoin demand in Asian markets, particularly China, to gauge cryptocurrency risk appetite. When investors rush to exit crypto positions, this indicator typically drops below parity. Currently, Tether trades at a 0.2% discount relative to the US dollar/Yuan exchange rate, suggesting moderate but not extreme outflows. This represents a slight improvement from the 1% discount observed last week.
Historical data shows stablecoins normally trade at a 0.5% to 1% premium in these markets, making the current discount noteworthy but not alarming. This metric provides valuable context for understanding whether recent Bitcoin price movements reflect localized trading dynamics or broader capital flight from cryptocurrency assets.
| Indicator | Current Level | Historical Average | Significance |
|---|---|---|---|
| Options Delta Skew | 17% | 6% or less | Extreme fear |
| ETF Net Flows (30-day) | -$2.7B | Variable | Institutional caution |
| Futures Open Interest | $46B | $58B (3 months ago) | Reduced leverage |
| Stablecoin Premium (CNY) | -0.2% | +0.5% to +1% | Moderate outflows |
Technical Analysis and Support Levels
Bitcoin underwent a sharp 10% correction between Wednesday and Thursday, retesting the $81,000 level for the first time in over two months. This movement brought the cryptocurrency dangerously close to the psychologically important $80,000 support zone. Technical analysts note that Bitcoin has maintained an overall bullish structure despite recent weakness, with the 200-day moving average continuing to provide dynamic support at approximately $75,000.
The $80,000 level represents more than just a round number—it coincides with several technical factors:
- Previous resistance turned support: The level served as resistance in late 2024
- Fibonacci retracement: 38.2% retracement from recent highs
- Volume profile: High trading volume concentration around this price
- Institutional entry points: Many large buyers established positions near this level
Market Structure Health Assessment
Despite concerning surface indicators, several metrics suggest underlying market health. The reduction in futures open interest indicates decreased speculative leverage, potentially creating a more stable foundation for future price movements. Additionally, the options fear, while extreme, often marks sentiment extremes that precede trend reversals when combined with oversold technical conditions.
Market participants should consider that no asset maintains uninterrupted upward momentum indefinitely. Healthy markets require periodic corrections to reset valuations, flush out weak hands, and establish new support levels. Bitcoin’s 13% decline over fourteen days remains within normal parameters for cryptocurrency volatility, particularly following the asset’s substantial appreciation throughout 2024 and early 2025.
Comparative Asset Performance and Macro Context
Bitcoin’s recent performance must be evaluated within broader financial market context. Traditional assets including equities, bonds, and commodities have all experienced increased volatility amid shifting macroeconomic expectations. Federal Reserve policy uncertainty, geopolitical tensions, and global growth concerns have contributed to risk asset repricing across multiple categories.
Gold’s 18% gain over three months may have temporarily overshadowed Bitcoin’s appeal as a store of value, though both assets serve different but overlapping functions in diversified portfolios. The simultaneous pressure on both gold and Bitcoin suggests broader defensive positioning rather than cryptocurrency-specific concerns.
Conclusion
Bitcoin options markets have turned decisively bearish as BTC flirts with dropping below the critical $80,000 support level. Multiple factors contribute to current market dynamics, including spot ETF outflows, leverage liquidations, and emerging quantum computing concerns. However, underlying market structure appears healthier than surface indicators suggest, with reduced speculative positioning potentially creating conditions for more sustainable future growth.
Market participants should monitor several key developments: institutional flow patterns in spot Bitcoin ETFs, stablecoin premium/discount dynamics in Asian markets, and technical support around $80,000. While current sentiment reflects legitimate concerns, cryptocurrency markets have historically demonstrated resilience following periods of extreme fear. The coming weeks will determine whether current conditions represent a healthy correction within an ongoing bull market or the beginning of more substantial trend change.
FAQs
Q1: What does the Bitcoin options delta skew indicate about market sentiment?
The current 17% delta skew represents extreme fear among options traders, the highest level in over a year. This metric shows put options trading at a substantial premium to calls, indicating expectations of further downside.
Q2: How significant are the spot Bitcoin ETF outflows?
US-listed spot Bitcoin ETFs have seen $2.7 billion in net outflows since January 16, representing 2.3% of total assets under management. While noteworthy, this represents a modest percentage of overall holdings.
Q3: What is the quantum computing threat to Bitcoin?
Some experts worry quantum computers could eventually break blockchain cryptographic security. However, most analysts believe practical threats remain years away, and Bitcoin’s development community actively researches quantum-resistant solutions.
Q4: Why is the $80,000 level psychologically important for Bitcoin?
This round number represents a major support zone where many institutional investors established positions. It also aligns with several technical indicators including previous resistance levels and Fibonacci retracement points.
Q5: How does reduced futures open interest affect market stability?
Lower open interest indicates decreased speculative leverage, potentially creating a healthier market foundation. While it may reduce immediate upside potential, it also decreases the risk of cascading liquidations during volatility.