Bitcoin Price Analysis: Critical Bottoming Phase Ends Amid Unprecedented Macro Volatility
Global cryptocurrency markets enter a pivotal transition as Bitcoin’s extended bottoming phase concludes during the final week of January 2026. The leading digital asset faces simultaneous pressure from Federal Reserve policy decisions, geopolitical instability, and historic competition from precious metals. Consequently, traders and analysts globally monitor key technical levels and macroeconomic signals that could determine Bitcoin’s trajectory through what many predict will be a volatile year for global finance.
Bitcoin Technical Analysis: Support Levels Under Siege
Bitcoin price action reveals critical technical developments as the asset tests significant support zones. The BTC/USD pair recently dropped to approximately $86,000 around the weekly close, a level market participants identified as a crucial threshold. Currently, buyers demonstrate defense at this level during Asian trading sessions, though resistance near $90,000 remains formidable.
Technical analysts emphasize the importance of weekly closes relative to key moving averages. Keith Alan, cofounder of Material Indicators, specifically highlights the 2026 yearly open near $87,500 and the 100-week simple moving average at $87,250 as decisive markers. A sustained close below these levels could signal further bearish momentum, according to his analysis shared on social media platform X.
Market data reveals substantial cross-crypto liquidations approaching $750 million within a 24-hour period, indicating heightened volatility and leveraged position unwinding. Several trading forecasts now suggest potential moves toward the low $80,000 range in coming weeks, particularly if Bitcoin fails to reclaim higher support levels.
Analyst Perspectives on Market Structure
Prominent market voices offer contrasting yet insightful views on current conditions. Michaël van de Poppe, a recognized crypto trader and analyst, describes the coming week as presenting a “generational opportunity” across cryptocurrency markets. He attributes recent selloffs to market preparation for anticipated volatility rather than fundamental weakness.
Meanwhile, analyst BitQuant presents a definitive stance, stating publicly that the current week marks the conclusive end of Bitcoin’s bottoming phase. He maintains a long-term bullish outlook, projecting an eventual high of $145,000, though he acknowledges near-term uncertainty. These professional perspectives collectively underscore the complex, multi-timeframe analysis required in current market conditions.
Macroeconomic Crosscurrents: Fed Policy and Global Instability
The Federal Open Market Committee meeting scheduled for January 28, 2026, represents the week’s most significant macroeconomic event. Market participants widely expect the Federal Reserve to maintain current interest rates. However, Chair Jerome Powell’s accompanying guidance and press conference language will receive intense scrutiny for signals about future policy direction.
Beyond standard monetary policy, several unusual factors contribute to market anxiety. Tensions between the Federal Reserve and the executive branch persist, with public statements from President Donald Trump advocating for significantly lower interest rates. Simultaneously, a legal investigation into Fed building renovations adds an unusual political dimension to central bank operations.
The trading resource The Kobeissi Letter characterizes 2026 as poised to be a “wild year,” citing expected leadership changes at the Fed and aggressive political pressure on monetary policy. These developments occur against a backdrop of stalled disinflation, with core consumer inflation measures hovering near 3% annually—persistently above the Fed’s 2% target.
Additional Volatility Sources
- Japanese Economic Concerns: Worries about Japan’s economy and Federal Reserve interventions in yen markets.
- Trade Policy Uncertainty: Unresolved international trade questions creating global economic friction.
- Government Shutdown Threat: A potential U.S. government shutdown adding to market uncertainty.
- Producer Price Index Data: December PPI release following November’s higher-than-expected print.
Precious Metals Outperformance and Crypto Implications
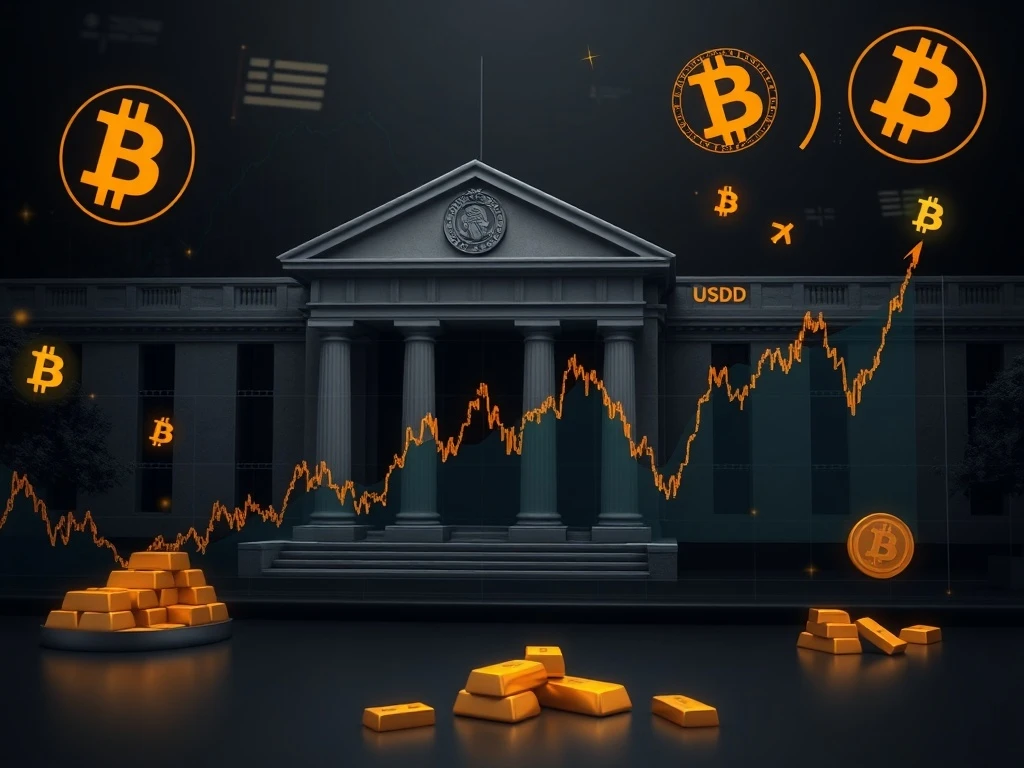
A striking divergence emerges between cryptocurrency and traditional safe-haven assets. Gold achieved a historic milestone, surpassing $5,000 per ounce to reach $5,111, while silver broke the $100 barrier, hitting $110 during Asian trading. These record highs contrast sharply with Bitcoin’s range-bound performance over recent months.
Analytical comparisons reveal the scale of this divergence. Over approximately thirteen months, silver prices surged roughly 270% while Bitcoin declined about 11%. This performance gap has expanded silver’s market capitalization to an estimated 3.5 times that of Bitcoin, according to data shared by The Kobeissi Letter.
Van de Poppe offers a compelling comparative analysis, noting that the Bitcoin versus gold valuation gap represents the widest disparity ever recorded. He argues that valuation against other assets like gold provides more meaningful insight than dollar-denominated pricing alone. His analysis identifies unprecedented bullish divergence potential on Bitcoin versus silver charts, suggesting possible capital rotation ahead.
On-Chain Metrics Reveal Investor Sentiment Shifts
Blockchain data provides objective evidence of changing investor behavior during recent price movements. Analytics from Checkonchain, shared by the account Frank A. Fetter, indicates short-term Bitcoin holders are realizing losses at historically significant levels. The realized profit/loss ratio for wallets holding BTC six months or less has reached unprecedented lows, surpassing even levels observed during the 2022 bear market bottom.
CryptoQuant data corroborates this trend, showing the overall Bitcoin supply in profit has declined to 62%. This marks the lowest level since September 2024 and falls below the 70% threshold that historically signals potential further decline when recovery above 80% fails to materialize.
Despite these bearish on-chain signals, exchange order book analysis suggests controlled rather than panicked selling. Contributor Arab Chain notes that volume delta data from major exchanges like Binance shows significant but manageable selling pressure. The market demonstrates sufficient liquidity to absorb distribution without catastrophic price collapses, indicating what analysts describe as “tactical” or “rebalancing” phase selling.
Conclusion
Bitcoin concludes a critical bottoming phase amid unprecedented macroeconomic crosscurrents and technical pressure. The convergence of Federal Reserve policy uncertainty, geopolitical instability, and historic precious metals outperformance creates a uniquely complex environment for cryptocurrency valuation. While on-chain metrics reveal significant short-term holder distress, market structure analysis suggests controlled rather than chaotic selling. As the January 2026 close approaches, Bitcoin’s ability to defend key technical levels near $86,000 will provide crucial signals about near-term direction. Ultimately, the coming weeks may determine whether current volatility represents a final consolidation before upward movement or the precursor to further testing of lower support zones.
FAQs
Q1: What does “bottoming phase” mean in Bitcoin analysis?
A bottoming phase refers to a period where an asset’s price stops declining and begins consolidating at a support level, potentially forming a base for future upward movement. Analysts monitor specific technical indicators and on-chain data to identify when this phase concludes.
Q2: Why is the Federal Reserve’s January 2026 meeting particularly significant?
This meeting occurs amid unusual political pressure on monetary policy, potential leadership changes at the Fed, and stalled disinflation. Markets are watching for signals about future rate cuts despite inflation remaining above the 2% target.
Q3: How significant is the outperformance of gold and silver compared to Bitcoin?
The divergence is historically notable, with silver gaining approximately 270% in thirteen months while Bitcoin declined 11%. This has expanded silver’s market cap to 3.5 times Bitcoin’s, raising questions about capital rotation between asset classes.
Q4: What do on-chain metrics indicate about current Bitcoin investor sentiment?
Data shows short-term holders are realizing losses at record levels, surpassing even 2022 bear market extremes. The percentage of Bitcoin supply in profit has fallen to 62%, below thresholds that historically preceded further declines.
Q5: Is the current selling pressure indicative of a market crash?
Exchange order book analysis suggests the selling is “tactical” and controlled rather than panicked. Sufficient market liquidity exists to absorb distribution without catastrophic price collapses, characteristic of rebalancing phases rather than structural breakdowns.