XRP Price Analysis: Working through the Critical ‘Max Pain’ Zone as Experts Warn of Potential $0.65 Test
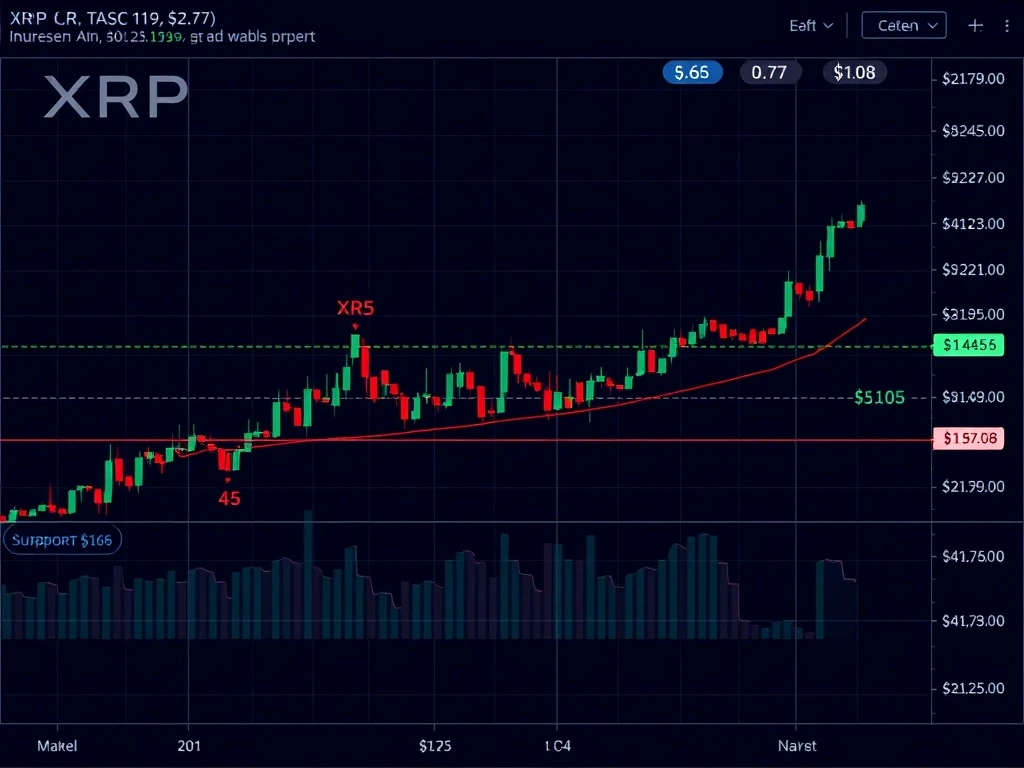
XRP, the digital asset associated with Ripple Labs, currently faces a major technical juncture that cryptocurrency traders globally are monitoring closely. Following a recent bounce from the $1.16 support level, the asset remains constrained below the significant $1.56 resistance, creating what analysts describe as a ‘max pain’ zone where market indecision reaches its peak. This technical configuration suggests significant volatility ahead, with prominent crypto analyst EGRAG CRYPTO warning of a potential final decline toward the $0.65 level before any sustained recovery.
XRP Technical Analysis: Current Market Position and Indicators
XRP’s current price action reveals several critical technical elements that professional traders consider when assessing market direction. The asset recently demonstrated short-term bullish momentum after finding support at $1.16, representing a 26% decline from its monthly high. However, this upward movement faces immediate resistance at the $1.56 level, which has acted as both support and resistance throughout 2024. The Moving Average Convergence Divergence (MACD) indicator recently completed a bullish crossover, confirming increasing buying pressure among market participants.
Also read: Circle USDC Freeze Reversal: Critical KYT Compliance Decision Unlocks 500 Casino and Whale Wallets
This technical development typically signals either a relief rally within a broader downtrend or the early stages of a genuine trend reversal. Market data from major exchanges shows that XRP trading volume increased by 18% during the recent bounce, suggesting heightened institutional and retail interest at these price levels. Furthermore, the Relative Strength Index (RSI) currently sits at 42, indicating neither overbought nor oversold conditions and leaving room for movement in either direction.
Critical Support Zones: The $0.77–$1.08 Untouched Lows
Technical analysts emphasize the importance of untouched support zones in cryptocurrency markets. For XRP, the price range between $0.77 and $1.08 represents a significant area where limited trading activity has occurred historically. These levels often attract what traders call ‘liquidity sweeps,’ where prices briefly dip to trigger stop-loss orders before reversing direction. Market structure analysis suggests that XRP may need to test these lower levels to establish a stronger foundation for future upward movement.
Also read: CFTC Chair Demands Urgent Rules for Crypto, AI, and Prediction Markets
The $0.75–$0.65 range represents a particularly critical zone that dates back to accumulation patterns observed in early 2023. Several blockchain analytics firms report that substantial XRP holdings accumulated between these price points, creating what technical analysts describe as ‘high-density support.’ A test of this area would represent a 44% decline from current levels but would align with historical support retests that preceded previous bull markets. Market sentiment indicators show that traders remain cautious, with funding rates slightly negative across major perpetual swap markets.
Expert Perspectives: EGRAG CRYPTO’s Analysis and Market Implications
Prominent cryptocurrency analyst EGRAG CRYPTO has gained attention for his detailed XRP technical analysis, particularly regarding the potential final drop scenario. His assessment combines traditional technical analysis with on-chain metrics, noting that whale accumulation has increased near the $0.85 level. According to blockchain data from Santiment and Glassnode, addresses holding between 1 million and 10 million XRP have increased their positions by approximately 3.2% over the past month.
EGRAG’s analysis references the ‘Wyckoff method,’ a technical analysis framework that examines accumulation and distribution phases in financial markets. His interpretation suggests XRP may be completing a ‘spring’ phase, where prices undercut support levels to shake out weak holders before beginning a sustained upward trend. This perspective aligns with observations from other analysts who note that similar patterns preceded XRP’s 2017 and 2021 bull runs. However, market conditions differ significantly from previous cycles due to regulatory developments and institutional adoption.
Market Context: Regulatory Developments and Institutional Adoption
The broader context surrounding XRP includes significant regulatory and institutional developments that influence price action. Ripple Labs continues its legal proceedings with the U.S. Securities and Exchange Commission, with recent court decisions providing partial clarity on XRP’s regulatory status. Institutional adoption has progressed steadily, with multiple financial institutions implementing Ripple’s payment solutions despite ongoing legal uncertainties. These fundamental factors create a complex backdrop against which technical patterns unfold.
Comparative analysis with other major cryptocurrencies reveals that XRP has demonstrated relative strength against Bitcoin throughout 2024, maintaining its value better than many altcoins during market downturns. The XRP/BTC trading pair shows a potential basing pattern that often precedes outperformance during bull markets. Additionally, on-chain metrics indicate that long-term holder behavior remains stable, with the percentage of XRP held for over one year reaching approximately 75% of circulating supply.
Historical Precedents: Learning from Previous Market Cycles
Historical analysis provides valuable context for understanding XRP’s current technical position. During the 2018-2020 bear market, XRP experienced a similar ‘max pain’ zone where prices consolidated for approximately 18 months before beginning a sustained upward movement. That consolidation phase included multiple tests of key support levels, with the final test occurring approximately 40% below the consolidation range before the subsequent rally began.
The table below illustrates key support and resistance levels for XRP based on historical data:
| Level Type | Price Range | Historical Significance |
|---|---|---|
| Primary Resistance | $1.56–$1.70 | 2021–2024 accumulation/distribution zone |
| Intermediate Support | $1.08–$1.16 | Recent bounce level and short-term support |
| Critical Support | $0.77–$0.85 | Untouched lows and high-density accumulation |
| Maximum Pain Zone | $0.65–$0.75 | Potential final test area per analyst projections |
Market participants should consider several key factors when evaluating XRP’s potential trajectory:
- On-chain metrics: Active addresses and transaction volume provide insight into network utility
- Exchange flows: Movements between wallets and exchanges indicate accumulation or distribution
- Derivatives data: Funding rates and open interest reveal trader positioning
- Macro conditions: Interest rates and regulatory developments impact all cryptocurrencies
- Technical structure: Support/resistance levels and chart patterns guide entry/exit decisions
Conclusion
XRP stands at a critical technical crossroads as it navigates what analysts term the ‘max pain’ zone between established support and resistance levels. The potential for a final decline toward the $0.65 area represents both risk and opportunity for market participants, depending on their time horizon and risk tolerance. Technical indicators suggest increasing buying pressure, while untouched support zones indicate possible liquidity sweeps ahead. As always in cryptocurrency markets, prudent risk management and consideration of both technical and fundamental factors remain essential for dealing with this volatile environment successfully.
FAQs
Q1: What does ‘max pain zone’ mean in cryptocurrency trading?
The term describes a price range where market indecision reaches its peak, often characterized by low volatility and compressed trading ranges before a significant directional move. For XRP, this refers to the area between key support at $1.08 and resistance at $1.56.
Q2: How reliable is the MACD indicator for predicting XRP price movements?
The Moving Average Convergence Divergence provides valuable information about momentum shifts but should never serve as a standalone signal. Professional traders combine MACD readings with other indicators, volume analysis, and market structure for more reliable assessments.
Q3: What fundamental factors could influence XRP’s price beyond technical analysis?
Regulatory developments in the Ripple-SEC case, institutional adoption of Ripple’s payment solutions, broader cryptocurrency market trends, and macroeconomic conditions all significantly impact XRP’s fundamental valuation and price action.
Q4: How does the ‘untouched lows’ concept affect trading decisions?
Untouched support or resistance areas often attract price action because they represent zones with concentrated liquidity. Market makers may push prices to these levels to trigger stop-loss orders before reversing direction, creating both risk and opportunity.
Q5: What time frame should traders consider when evaluating the potential $0.65 test?
Analyst projections vary, but most technical patterns suggesting a test of lower levels would typically unfold over weeks to months rather than days. The specific timing depends on broader market conditions and catalyst developments.
This article was produced with AI assistance and reviewed by our editorial team for accuracy and quality.