Ethereum Price Plummets Below $3K: Critical Technical Breakdown Targets $2,250 in February
Ethereum faces renewed selling pressure in early February 2025 as ETH price decisively breaks below the vital $3,000 psychological support level, confirming a bearish technical pattern that could push the cryptocurrency toward $2,250. This development follows the Federal Reserve’s January policy decision and escalating geopolitical tensions that have dampened risk appetite across global financial markets.
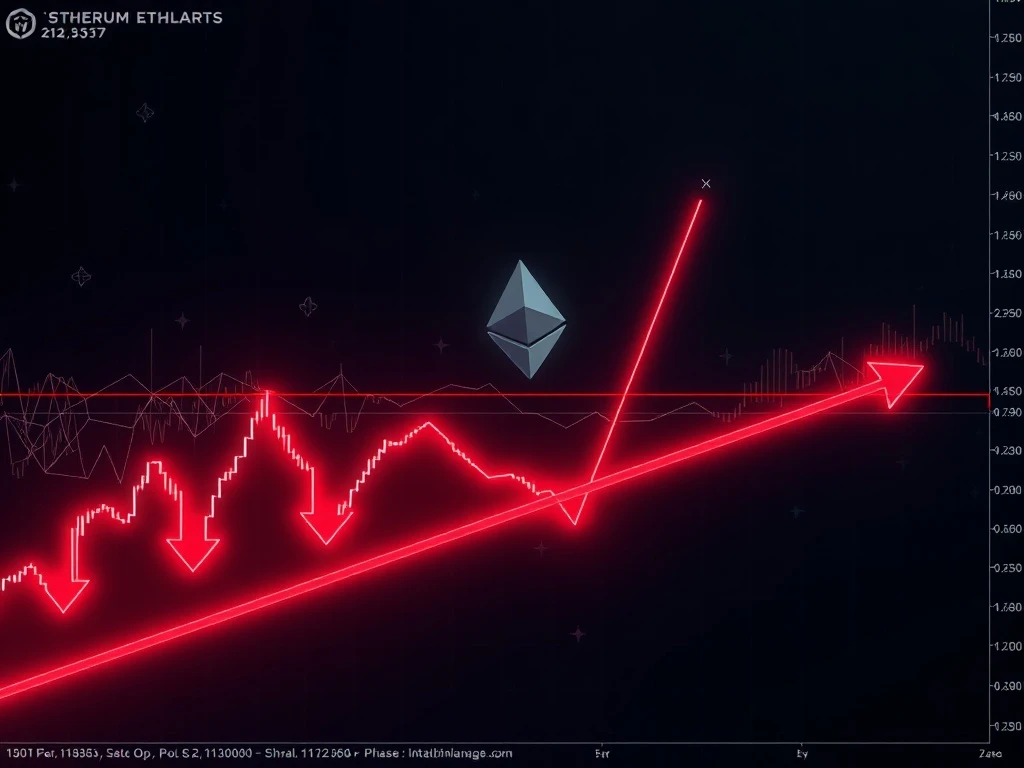
Ethereum Price Technical Breakdown Analysis
The ETH/USD trading pair has confirmed a symmetrical triangle breakdown on daily charts, marking a significant shift in near-term market sentiment. This technical pattern, which had been developing since November 2024, saw its lower trendline support fail last week. Subsequently, Ethereum attempted to reclaim this level but faced immediate rejection, transforming former support into resistance. Technical analysts note that such failed retests typically precede extended downward movements.
Also read: Pendle Joins Wall Street Titans in Key Talks on Vietnam's Financial Hub Ambitions
Market data reveals Ethereum now trades approximately 14% below its recent peak near $3,400, recorded in mid-January 2025. The breakdown follows a period of consolidation where ETH struggled to maintain momentum above $3,100 despite several bullish catalysts. Trading volume patterns show increased selling pressure during the breakdown phase, with notable institutional outflows from Ethereum-based investment products according to recent exchange reports.
Symmetrical Triangle Pattern and Price Targets
Symmetrical triangles represent consolidation patterns where price action converges between two trendlines with similar slopes. The breakdown occurs when price decisively moves below the lower trendline with accompanying volume. In Ethereum’s current setup, the measured move target calculates to approximately $2,250, representing a 25% decline from current levels. This target derives from the pattern’s height projected downward from the breakdown point.
Also read: Crypto ATM Network Declines: Early 2026 Growth Stalls as Removals Accelerate
Several key technical indicators support the bearish outlook:
- Moving Average Alignment: The 50-day exponential moving average (EMA) has maintained resistance above $3,000 since November
- Momentum Indicators: The Relative Strength Index (RSI) has entered oversold territory but shows no bullish divergence
- Volume Profile: Higher volume on down days confirms institutional selling participation
- Support Levels: Historical data shows significant liquidity pools between $2,500 and $2,700
Market Context and Macroeconomic Factors
The Federal Reserve’s January 2025 policy meeting maintained interest rates at current levels while signaling continued quantitative tightening. This monetary policy stance has generally pressured risk assets, including cryptocurrencies. Additionally, rising geopolitical tensions in the Middle East have contributed to broader market risk aversion. Traditional safe-haven assets like gold and U.S. Treasury bonds have seen increased demand during this period, diverting capital from speculative investments.
Cryptocurrency market correlation data shows Ethereum maintaining approximately 0.85 correlation with Bitcoin during the recent downturn. This high correlation suggests broader market dynamics rather than Ethereum-specific issues are driving the price action. However, Ethereum’s underperformance relative to Bitcoin in recent weeks indicates some asset-specific weakness, potentially related to network activity metrics or DeFi sector developments.
Potential Bullish Scenarios and Key Resistance Levels
Despite the bearish technical setup, several factors could invalidate the downward projection. The most immediate bullish scenario requires Ethereum to reclaim the triangle’s lower trendline as support, currently near $3,020. Following this, ETH would need to break above the 200-day EMA at approximately $3,065 and, more importantly, the 50-day EMA that has capped all significant rallies since November.
A successful reclaim of these technical levels would mirror a similar pattern from 2024, when Ethereum experienced a false breakdown before reversing to new yearly highs. This historical precedent provides context for potential bullish reversals. Furthermore, fundamental developments continue to support Ethereum’s long-term value proposition:
| Metric | Current Value | 30-Day Change |
|---|---|---|
| Daily Active Addresses | 487,000 | +8.2% |
| Network Revenue | $8.2M | +15.7% |
| Total Value Locked (DeFi) | $42B | +12.3% |
| Staked ETH Percentage | 28.4% | +2.1% |
Expert Analysis and Long-Term Projections
Despite short-term technical concerns, several prominent analysts maintain bullish long-term Ethereum forecasts. Standard Chartered reiterated its $7,500 price target for 2026 in a recent research note, citing Ethereum’s dominant position in decentralized finance and institutional adoption trends. Independent analyst Annie references Wyckoff accumulation models suggesting potential moves toward $10,000, though she emphasizes this represents a multi-year timeframe rather than immediate prospects.
These projections align with broader industry expectations for Ethereum’s upcoming protocol improvements. The continued development of layer-2 scaling solutions and anticipated network upgrades could fundamentally improve Ethereum’s utility and value proposition. However, analysts universally caution that short-term price movements often diverge from long-term fundamentals, particularly in volatile cryptocurrency markets.
February Market Outlook and Trading Considerations
February typically presents mixed historical performance for cryptocurrencies, with average returns slightly negative over the past five years. Several factors specific to February 2025 warrant consideration. First, tax-related selling pressure in certain jurisdictions may temporarily affect market liquidity. Second, regulatory developments, particularly regarding cryptocurrency exchange-traded products, could introduce volatility. Finally, the options market shows increased put buying at the $2,500 strike price, indicating some traders anticipate further downside.
Risk management remains paramount for market participants. Technical analysts recommend watching the $2,800 level as immediate support, with a break potentially accelerating movement toward the $2,250 target. Conversely, a sustained move above $3,100 would suggest the breakdown has failed, potentially triggering short covering and renewed bullish momentum. Market participants should monitor trading volume patterns for confirmation of either scenario.
Conclusion
Ethereum faces critical technical tests in February 2025 following its breakdown below $3,000. The confirmed symmetrical triangle pattern suggests potential movement toward $2,250 if current bearish momentum persists. However, fundamental network metrics remain strong, and long-term analyst projections continue to forecast significant appreciation. Market participants should monitor key technical levels at $2,800 support and $3,100 resistance while considering broader macroeconomic factors affecting cryptocurrency valuations. The Ethereum price action in coming weeks will likely determine intermediate-term trend direction.
FAQs
Q1: What caused Ethereum to drop below $3,000?
The breakdown resulted from technical pattern completion combined with broader market risk aversion following Federal Reserve policy decisions and geopolitical tensions. Increased selling pressure confirmed the symmetrical triangle breakdown.
Q2: How reliable are symmetrical triangle patterns for price predictions?
While no technical pattern guarantees outcomes, symmetrical triangles have approximately 65-70% reliability for reaching measured move targets when confirmed with volume. False breakouts occur in about 30% of cases, making confirmation essential.
Q3: What would invalidate the bearish Ethereum price forecast?
A sustained reclaim above $3,100, particularly with strong volume, would invalidate the breakdown. This would require flipping former support-turned-resistance back to support and breaking above key moving averages.
Q4: How does Ethereum’s current situation compare to 2024?
Similar technical patterns appeared in 2024, resulting in false breakdowns before significant rallies. However, macroeconomic conditions differ, with higher interest rates and different regulatory environments affecting current market dynamics.
Q5: Should investors consider buying Ethereum at current levels?
Investment decisions depend on individual risk tolerance, time horizon, and portfolio strategy. While current levels may present long-term value, short-term volatility could continue. Diversification and position sizing remain vital considerations.
This article was produced with AI assistance and reviewed by our editorial team for accuracy and quality.