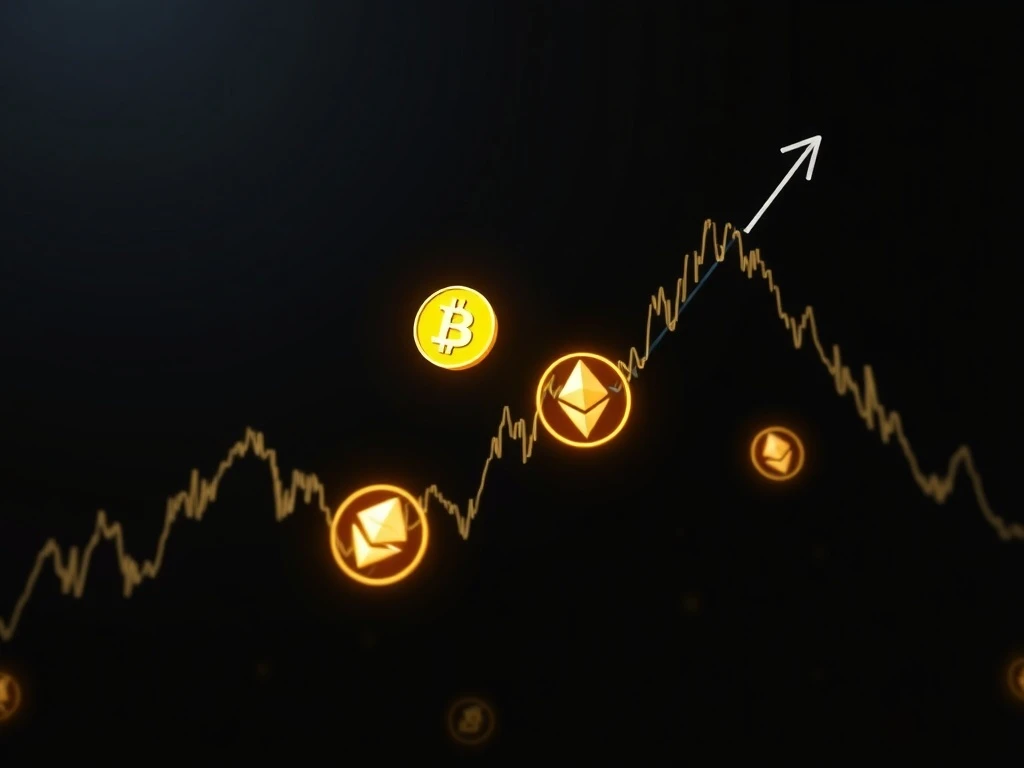
BTC Dominance Decline Signals Vital ETH-Led Market Rotation Phase
Global cryptocurrency markets are witnessing a significant technical development as Bitcoin’s market dominance shows clear weakening patterns, potentially signaling the early stages of an Ethereum-led market rotation that could reshape capital allocation across digital assets throughout 2025. This shift in BTC.D metrics represents more than just statistical noise—it reflects fundamental changes in investor positioning, institutional strategy, and technological adoption trends that merit careful examination by market participants worldwide.
BTC Dominance Technical Breakdown and Historical Context
Bitcoin dominance, representing Bitcoin’s percentage of total cryptocurrency market capitalization, has failed to reclaim previous highs after months of steady gains. The metric now shows a distinct lower high pattern on weekly charts, indicating potential trend reversal. Historically, BTC.D movements have served as reliable indicators for broader market rotations. For instance, during the 2017-2018 cycle, similar dominance declines preceded substantial altcoin rallies. Technical analysts note that the current BTC.D reading of approximately 52% represents a critical psychological level that, if broken, could accelerate rotation toward alternative cryptocurrencies.
Also read: Zcash Analysis: Grayscale's Bold Claim on Private Money's Future and ZEC's Value
Market data reveals several supporting factors for this potential shift. Ethereum’s network activity has increased substantially, with daily transactions reaching multi-month highs. Simultaneously, institutional positioning data shows reduced Bitcoin exposure among major funds while Ethereum allocations have grown. The correlation between Bitcoin and traditional markets has strengthened recently, potentially making Ethereum more attractive to investors seeking cryptocurrency-specific exposure. These developments collectively suggest that the current BTC.D weakness may represent more than temporary market noise.
Ethereum Positioning and Market Structure Analysis
Ethereum’s technical and fundamental positioning shows notable improvements coinciding with Bitcoin dominance declines. The Ethereum network has processed over 1.2 million transactions daily for three consecutive weeks, representing a 40% increase from previous months. This activity surge demonstrates growing utility beyond speculative trading. Furthermore, Ethereum’s staking participation rate has reached record levels, with approximately 25% of circulating supply now securing the network through proof-of-stake mechanisms. This fundamental strength provides a solid foundation for potential market leadership.
Market structure analysis reveals several key developments. First, Ethereum’s options market shows increasing bullish positioning, with call option volume exceeding puts by a significant margin. Second, exchange reserves for Ethereum have declined steadily, indicating reduced selling pressure. Third, institutional investment products tracking Ethereum have recorded consistent inflows while Bitcoin products have seen mixed results. These structural factors combine to create favorable conditions for Ethereum to potentially lead the next market phase.
Expert Perspectives on Capital Rotation Signals
Financial analysts and blockchain researchers provide valuable context for interpreting these market signals. Dr. Sarah Chen, cryptocurrency market analyst at Global Digital Assets Research, notes: “The BTC.D metric serves as a critical sentiment indicator. Current patterns resemble early 2021 conditions before Ethereum significantly outperformed Bitcoin. However, market participants should consider multiple confirming indicators before concluding a sustained rotation is underway.”
Historical data supports careful interpretation. Previous BTC.D declines have sometimes preceded altcoin rallies but have also occurred during broader market corrections. The current situation differs due to Ethereum’s post-merge fundamentals and growing institutional adoption. Regulatory developments, particularly regarding Ethereum-based financial products, may further influence capital allocation decisions. Market participants should monitor these factors alongside technical indicators.
Comparative Analysis of Market Leadership Factors
The following table illustrates key differences between current market conditions and previous rotation periods:
| Factor | Current Market (2025) | Previous Rotation (2021) |
|---|---|---|
| BTC Dominance Level | ~52% and declining | ~40% before rotation |
| Ethereum Network Activity | Record transaction volume | Moderate growth |
| Institutional Participation | Mature products and frameworks | Early adoption phase |
| Regulatory Environment | Clearer guidelines emerging | Significant uncertainty |
| Market Capitalization | Larger, more liquid markets | Smaller, more volatile |
Several critical factors distinguish the current environment. First, cryptocurrency markets have matured substantially since previous rotations. Second, institutional participation has become more sophisticated. Third, regulatory frameworks have developed significantly. Fourth, technological infrastructure has improved dramatically. These differences suggest that any potential rotation may unfold differently than historical patterns.
Technical Indicators and Confirmation Signals
Market technicians emphasize the importance of confirmation before declaring a sustained rotation. Key indicators to monitor include:
- BTC.D weekly close levels – Sustained breaks below 50% would strengthen rotation thesis
- Ethereum/Bitcoin pair momentum – ETH/BTC ratio trends provide direct rotation evidence
- Volume confirmation – Rotation requires increasing volume on Ethereum rallies
- Market breadth – Broad altcoin participation strengthens rotation validity
- On-chain metrics – Network activity and holder behavior provide fundamental confirmation
Current data shows promising but incomplete confirmation. The ETH/BTC ratio has shown strength but remains within a broader consolidation range. Volume patterns show improvement but lack decisive breakout characteristics. Market breadth has expanded moderately, with several major altcoins showing relative strength. On-chain metrics demonstrate solid fundamental support for Ethereum. These mixed signals suggest cautious optimism rather than definitive conclusions.
Impact on Portfolio Strategy and Risk Management
Potential market rotation carries significant implications for investment strategy. Portfolio managers should consider several approaches. First, diversification across major cryptocurrencies may reduce concentration risk. Second, dynamic allocation adjustments based on momentum indicators could capture rotation benefits. Third, risk management protocols should account for increased volatility during transition periods. Fourth, fundamental analysis should complement technical signals when making allocation decisions.
Historical analysis provides valuable perspective. Previous rotations have typically lasted several months but varied in intensity. The 2020-2021 rotation saw Ethereum gain approximately 300% against Bitcoin over nine months. However, not all BTC.D declines have led to sustained altcoin outperformance. The 2019 decline, for instance, preceded a broader market correction. This historical variability underscores the importance of comprehensive analysis and disciplined risk management.
Conclusion
The developing BTC dominance decline represents a potentially significant market development that warrants close attention from cryptocurrency participants. While technical patterns suggest early rotation signals toward Ethereum and other altcoins, confirmation through multiple indicators remains essential. Market structure improvements, institutional participation growth, and fundamental network strength provide favorable conditions for potential rotation. However, historical patterns demonstrate variability in such transitions. Market participants should monitor developments carefully while maintaining disciplined risk management practices. The coming weeks will likely provide clearer evidence regarding the sustainability and magnitude of any BTC dominance decline and subsequent ETH-led market phase.
FAQs
Q1: What does Bitcoin dominance measure and why is it important?
Bitcoin dominance calculates Bitcoin’s percentage of total cryptocurrency market capitalization. This metric matters because it indicates relative strength between Bitcoin and alternative cryptocurrencies, often signaling market rotation phases.
Q2: How reliable are BTC.D signals for predicting market rotations?
Historical analysis shows moderate reliability, with previous declines sometimes preceding altcoin rallies. However, confirmation through additional indicators like volume, market breadth, and fundamental metrics improves prediction accuracy significantly.
Q3: What factors could invalidate the current rotation signals?
Several developments could challenge the rotation thesis: Bitcoin regaining dominance through institutional inflows, broader market corrections affecting all cryptocurrencies, regulatory actions specifically impacting Ethereum, or technical failures in Ethereum network upgrades.
Q4: How should investors adjust portfolios during potential rotations?
Portfolio adjustments should consider diversification, momentum indicators, risk tolerance, and investment horizon. Gradual rebalancing based on confirmed signals typically proves more effective than abrupt changes based on early indicators alone.
Q5: What time frame typically characterizes cryptocurrency market rotations?
Historical rotations have varied from several weeks to multiple months. The 2020-2021 rotation lasted approximately nine months, while shorter rotations have occurred during specific market conditions. Monitoring ongoing developments provides the best guidance for timing.
This article was produced with AI assistance and reviewed by our editorial team for accuracy and quality.