Bitcoin’s Hidden February Surge: Why This Month Delivers Stunning 7% Weekly Returns
As January 2025 concludes with Bitcoin posting modest 2.2% monthly gains, cryptocurrency analysts are turning their attention to February’s historically bullish patterns. Network economist Timothy Peterson’s research reveals that February consistently delivers stronger median returns than October’s famous “Uptober” phenomenon, with the week ending February 21 recording an impressive 8.4% median return since 2016. This February seasonal edge, driven by macroeconomic factors rather than crypto-specific events, positions the coming weeks as potentially transformative for Bitcoin’s 2025 trajectory.
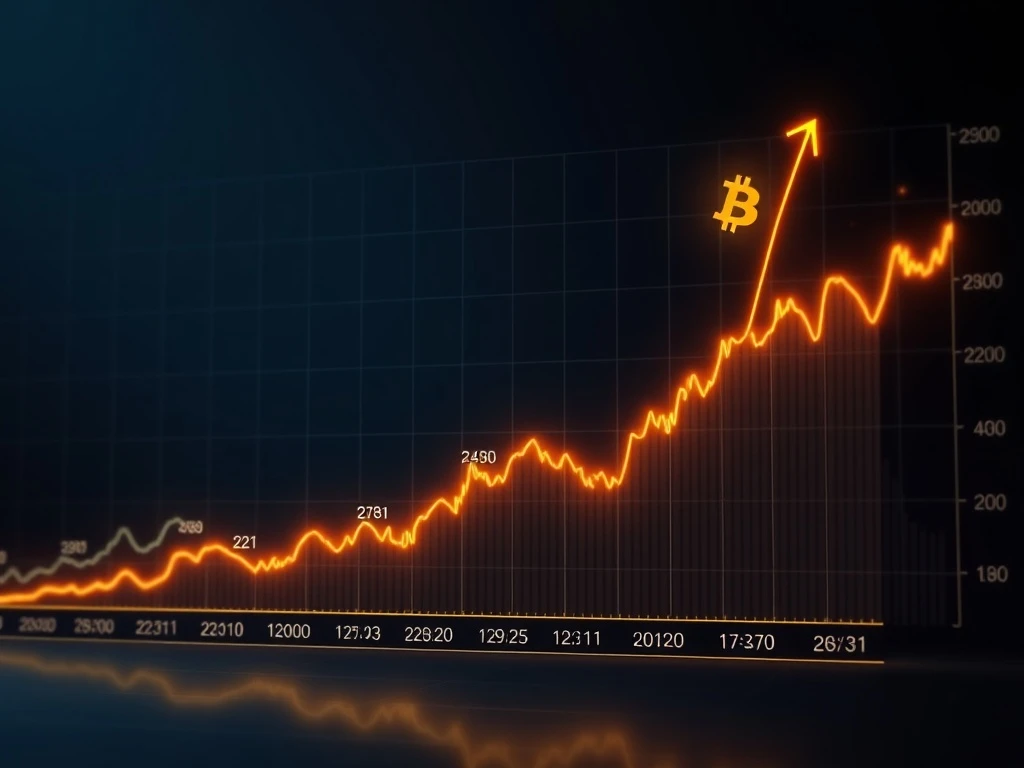
Bitcoin’s February Historical Performance Analysis
Historical data from 2016 onward demonstrates February’s remarkable consistency for Bitcoin returns. The cryptocurrency has closed higher 60% of the time during the week ending February 21, with median weekly returns reaching 7% during the February 7-21 period. This performance significantly outpaces October’s seasonal strength, challenging conventional wisdom about Bitcoin’s quarterly patterns. Furthermore, early-February movements have reliably signaled broader market directions, with 2018’s 4% gain, 2022’s 3% decline, and 2025’s 5% drop all setting tones for their respective years.
Also read: Zero-Knowledge Proofs Guide: Hoskinson's Free 337-Page GitHub Release Empowers Developers
Peterson’s analysis connects these patterns to macroeconomic timing rather than cryptocurrency-specific developments. Mid-February typically marks the release of full-year corporate earnings and forward guidance, which generally projects optimism across traditional markets. This corporate reporting season often encourages risk-on investor behavior, with capital rotation potentially benefiting Bitcoin alongside other risk assets. The correlation between traditional market sentiment and Bitcoin performance during this period suggests increasing institutional integration of cryptocurrency within broader portfolio strategies.
Macroeconomic Drivers Behind February’s Strength
The February effect stems from synchronized global financial calendar events rather than isolated cryptocurrency developments. Corporate earnings season reaches its peak during this period, providing investors with clearer visibility into economic health and corporate profitability. Additionally, many institutional investors complete their annual rebalancing processes in January, potentially creating capital flows into alternative assets like Bitcoin during February. Historical volatility patterns also show easing conditions following January’s typically turbulent markets, creating favorable conditions for sustained upward movements.
Also read: Crypto Liquidations Surge Past $450M as Options Expiry and Oil Shock Fuel Market Panic
Peterson specifically highlights the importance of macroeconomic stress indicators, particularly the CBOE’s volatility index (VIX). When the VIX cools from January peaks, risk assets including Bitcoin historically experience improved performance. This relationship demonstrates Bitcoin’s evolving correlation with traditional risk metrics, reflecting its maturation within global financial markets. The consistency of February’s outperformance across multiple market cycles suggests structural rather than coincidental factors at play, providing analysts with reliable seasonal patterns for market forecasting.
Technical and Fundamental Supporting Factors
Beyond seasonal patterns, several technical and fundamental factors support potential February strength. Bitcoin researcher Sminston With’s Bitcoin Decay Channel model places Bitcoin’s 2026 top price between $210,000 and $300,000, suggesting significant upside potential from current levels. While the model doesn’t predict specific timing, its historical accuracy provides context for Bitcoin’s long-cycle trajectory. Meanwhile, momentum indicators have turned positive despite recent corrections, with Sina’s Bitcoin Intelligence Report noting preserved flow structures through January’s consolidation period.
XWIN Research observations further support this analysis, indicating that Bitcoin remains in a consolidation phase rather than a clear risk-off trend. The continued rise in Realized Cap demonstrates ongoing spot-based capital entering the network, suggesting underlying strength despite price volatility. This fundamental metric, which calculates the value of all Bitcoin at the price they were last moved, provides key insight into actual capital deployment rather than speculative trading activity. The combination of strong fundamentals with favorable seasonal patterns creates compelling conditions for February performance.
Comparative Analysis: February Versus October Returns
Historical data reveals February’s consistent outperformance compared to October’s celebrated “Uptober” phenomenon. The following table illustrates key differences between these historically strong months:
| Metric | February Performance | October Performance |
|---|---|---|
| Median Weekly Return | 7% | 5.2% |
| Consistency Rate | 60% positive closes | 55% positive closes |
| Best Week Period | Feb 7-21 | Oct 15-31 |
| Primary Driver | Macroeconomic earnings season | Quarter-end portfolio rebalancing |
| Volatility Profile | Moderate, declining from January | High, increasing toward year-end |
This comparative analysis demonstrates February’s superior risk-adjusted returns, with higher median gains and greater consistency than October’s more volatile performance. The macroeconomic foundation of February’s strength provides more predictable drivers than October’s combination of technical and seasonal factors. Understanding these differences helps investors develop more nuanced seasonal trading strategies rather than relying on oversimplified calendar-based approaches.
Current Market Context and 2025 Outlook
Entering February 2025, Bitcoin faces unique market conditions that may amplify or moderate historical patterns. Recent corrections coincided with Nasdaq declines following renewed US tariff tensions, suggesting news-driven movements rather than Bitcoin-specific breakdowns. This correlation with traditional risk assets indicates Bitcoin’s continued integration within broader market sentiment, potentially strengthening February’s historical patterns if macroeconomic conditions align. However, elevated long-term bond yields continue limiting valuation expansion across risk assets, creating countervailing pressures on February’s typical bullish tendencies.
Analysts are particularly watching early-February performance for 2025 directional signals. Historical precedent shows that years beginning with February declines—like 2022 and 2025’s early drops—typically experience challenging full-year conditions. Conversely, strong February starts like 2018’s 4% gain preceded more favorable annual outcomes despite intermediate volatility. This early-month indicator function adds significance to February’s opening weeks beyond mere seasonal return patterns, providing valuable forward-looking information for portfolio positioning.
Risk Factors and Market Considerations
While historical patterns suggest February strength, several risk factors warrant consideration. Macroeconomic uncertainty remains elevated, with geopolitical tensions and monetary policy adjustments potentially disrupting typical seasonal flows. Additionally, cryptocurrency-specific developments including regulatory announcements or exchange developments could override broader seasonal tendencies. Investors should also consider that past performance never guarantees future results, particularly in evolving markets like cryptocurrency where structural changes occur rapidly.
The Bitcoin-to-gold ratio recently fell to new lows, indicating potential undervaluation relative to traditional safe-haven assets. Some analysts interpret this divergence as creating rare discounted setups for Bitcoin, potentially amplifying February’s historical strength if mean reversion occurs. However, this relationship also highlights Bitcoin’s evolving role within asset allocation frameworks, moving beyond pure risk-on categorization toward more nuanced portfolio functions. Understanding these shifting dynamics is critical for interpreting February performance within broader market context.
Conclusion
Bitcoin’s February performance history reveals compelling seasonal patterns that consistently outperform October’s famous “Uptober” phenomenon. With 7% median weekly returns during the February 7-21 period and 60% positive close rates since 2016, this month represents one of Bitcoin’s most reliably bullish periods. The macroeconomic drivers behind this strength—particularly corporate earnings season and institutional rebalancing—provide fundamental justification beyond mere calendar effects. As February 2025 approaches, market participants will watch early-month performance for directional signals while monitoring whether historical patterns persist amid evolving market structures. Regardless of short-term outcomes, understanding these seasonal tendencies provides valuable context for Bitcoin market analysis and investment strategy development.
FAQs
Q1: Why does Bitcoin historically perform well in February?
Bitcoin’s February strength primarily stems from macroeconomic factors including corporate earnings season and institutional portfolio rebalancing. These traditional market events often create risk-on sentiment that benefits Bitcoin alongside other risk assets.
Q2: How does February performance compare to October’s “Uptober”?
February consistently delivers higher median returns (7% weekly) than October (5.2% weekly) with greater consistency (60% vs 55% positive closes). February’s drivers are more macroeconomic while October’s combine technical and seasonal factors.
Q3: What specific February period shows strongest historical returns?
The week ending February 21 records the highest median return at 8.4% since 2016. The broader February 7-21 period shows median weekly returns of 7% with reliable consistency across market cycles.
Q4: Does early February performance predict full-year Bitcoin trends?
Historical data shows early February movements often signal broader annual directions. Years with February gains like 2018 typically experience better full-year outcomes, while February declines like 2022 and 2025 often precede challenging annual conditions.
Q5: What risk factors could disrupt February’s historical patterns in 2025?
Macroeconomic uncertainty, geopolitical tensions, cryptocurrency-specific regulatory developments, and unexpected monetary policy changes could all override typical seasonal patterns. Past performance never guarantees future results in evolving markets.
This article was produced with AI assistance and reviewed by our editorial team for accuracy and quality.