Bitcoin Soars: Unprecedented Rally Above $97K in 2026 Fuels Optimism for $100K Breakthrough
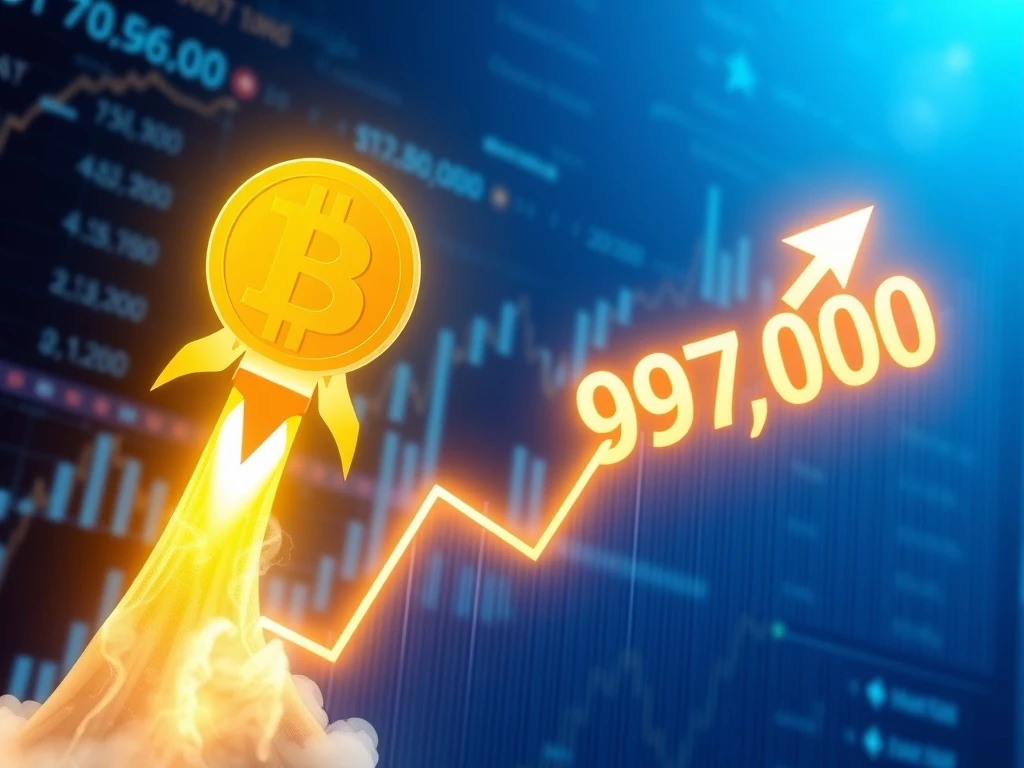
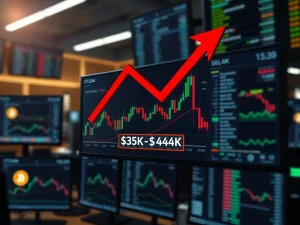
In a stunning start to 2026, Bitcoin (BTC) has shattered expectations by catapulting to a new yearly high above $97,000, igniting fervent discussion among traders and analysts about the potential for a sustained push past the psychologically significant $100,000 barrier. This remarkable price action, observed globally in the second week of January, not only confirms a critical shift in market structure but is also supported by a confluence of robust on-chain and derivatives metrics that historically precede extended bullish trends.
Bitcoin’s Technical Breakout and Market Structure Shift
The cryptocurrency’s ascent past $97,500 represents more than a simple price increase; it establishes a definitive “higher high” on daily timeframes. Consequently, this technical achievement effectively weakens near-term resistance levels that had previously capped upward movements. Market technicians highlight that securing a daily closing price firmly above $95,000 was the crucial confirmation needed for this new bullish phase.
Furthermore, the price chart now reveals a notably thin resistance band between $95,000 and the next major supply zone, which analysts identify between $103,300 and $107,500. This technical vacuum allows significant room for price expansion if current buying momentum persists. Notably, the recent surge liquidated approximately $270 million in leveraged short positions, forcibly removing a layer of selling pressure and potentially refocusing market liquidity clusters.
On-Chain Data Reveals Strengthening Foundation
Beyond chart patterns, underlying blockchain data provides compelling evidence that this rally possesses substantive strength. A key indicator, the Coinbase Premium Index, which tracks the price difference between Coinbase Pro and Binance, shows a crucial reset. After a period of sustained selling pressure from U.S.-based investors between January 6 and 11, the pace of this selling has demonstrably slowed. This deceleration suggests a reduction in panic-driven divestment, often a prerequisite for stable price appreciation.
Simultaneously, Bitcoin inflows to advanced trading desks like Coinbase Advanced are running at roughly 2.5 times their baseline average. Historically, similar inflow spikes have correlated with price appreciation, as they typically signal spot accumulation, over-the-counter (OTC) settlement activity, or strategic positioning for Exchange-Traded Funds (ETFs)—activities distinct from immediate sell-side pressure.
The Stablecoin Liquidity Signal
An intriguing, albeit muted, signal comes from stablecoin markets. Currently, major inflows of dollar-pegged assets like USDT and USDC into exchanges remain subdued. Seasoned analysts interpret this not as bearish, but as a potential waiting phase. In previous market cycles, stablecoin liquidity has frequently lagged behind initial Bitcoin price surges, only to flood in later as confirmation of renewed investor confidence, thereby acting as a conditional bullish signal for follow-through demand.
Derivatives Market Dynamics Fuel the Rally
The derivatives landscape offers perhaps the most striking validation of the rally’s intensity. Data from leading exchanges shows a dramatic hourly spike in Binance’s net taker volume, with a single candle exceeding $500 million in aggressive spot market buying. This metric, which reflects immediate execution of orders, indicates strong conviction from large buyers.
This aggressive buying coincided with two other critical factors:
- Rising Open Interest: The total value of outstanding derivative contracts increased alongside the price, signaling new capital entering the market rather than mere short-covering.
- Depressed Funding Rates: Bitcoin’s hourly funding rate across perpetual swap markets hit its lowest level since October 2025. Low or negative funding rates often indicate crowded short positions and cautious leverage use. As these rates normalized during the price climb, it triggered a squeeze, forcing short sellers to buy back BTC to close their positions, thereby amplifying the upward move.
Analyst Amr Taha of CryptoQuant noted that this specific combination—spiking spot volume with rising open interest—has historically aligned with trend continuation rather than temporary reversals. A similar setup earlier in January preceded a rapid move toward $96,000.
Key Price Levels and Future Trajectory
All eyes now pivot toward the symbolic $100,000 level. However, the technical roadmap suggests traders should monitor a broader range. The immediate path faces limited overhead resistance, making a technical rally toward $103,500 a plausible near-term scenario if momentum holds.
On the support side, the $92,500 to $90,000 region has emerged as critical. This zone represents a “daily order block” formed after the initial rally—a area where significant buying previously occurred. If Bitcoin establishes its next “higher low” within this range, it would structurally reinforce the bull case and strengthen the probability of a sustained breakthrough above $100,000 before the end of January.
It is essential to contextualize this move within a broader market characterized by relatively light liquidity across both spot and futures venues. This condition inherently increases volatility, leaving Bitcoin susceptible to sharp swings in either direction based on incremental capital flows or macroeconomic news.
Conclusion
The Bitcoin rally to over $97,000 in early 2026 is a multifaceted event supported by technical breakthroughs, reassuring on-chain accumulation signals, and explosive derivatives activity. While the allure of the $100,000 milestone dominates headlines, the underlying data—from the resetting Coinbase Premium Index to the massive net taker volume and squeezed funding rates—paints a picture of a move with considerable foundational strength. Traders will now watch for Bitcoin to hold key support near $92,500 as it challenges historic resistance levels, with the combined weight of current metrics suggesting sufficient fuel remains for higher prices in the weeks ahead.
FAQs
Q1: What does Bitcoin’s ‘higher high’ above $97,000 mean technically?
Technically, a ‘higher high’ confirms an uptrend by showing the asset’s price has surpassed its previous peak. For Bitcoin, closing above $95,000 after this rally invalidated prior resistance, suggesting a structural shift in market sentiment and opening the path toward $100,000.
Q2: Why is the Coinbase Premium Index important for this rally?
The Coinbase Premium Index gauges buying/selling pressure from U.S. institutional investors. Its reset after a selling period indicates reduced panic selling from a major market segment, which is a positive sign for price stability and future appreciation.
Q3: How do low funding rates contribute to a Bitcoin price surge?
Extremely low or negative funding rates signal that many traders are using leverage to bet against the price (shorting). When the price rises anyway, these short positions become unprofitable and are forced to buy back Bitcoin to close, creating additional upward pressure—a phenomenon known as a ‘short squeeze.’
Q4: What is the significance of the $500M+ Binance net taker volume spike?
Net taker volume measures aggressive market orders that immediately execute. A spike of this magnitude indicates that large buyers were willing to pay the asking price to acquire Bitcoin urgently, reflecting strong conviction and often preceding sustained bullish momentum.
Q5: Where is the next major resistance if Bitcoin breaks $100,000?
Analysis of historical order flow and chart patterns identifies the next significant supply zone between approximately $103,300 and $107,500. This area is where previous sellers might re-enter the market, potentially creating resistance.