XRP Price Analysis: The Strategic $1.30 Support Level After a 58% Market Correction
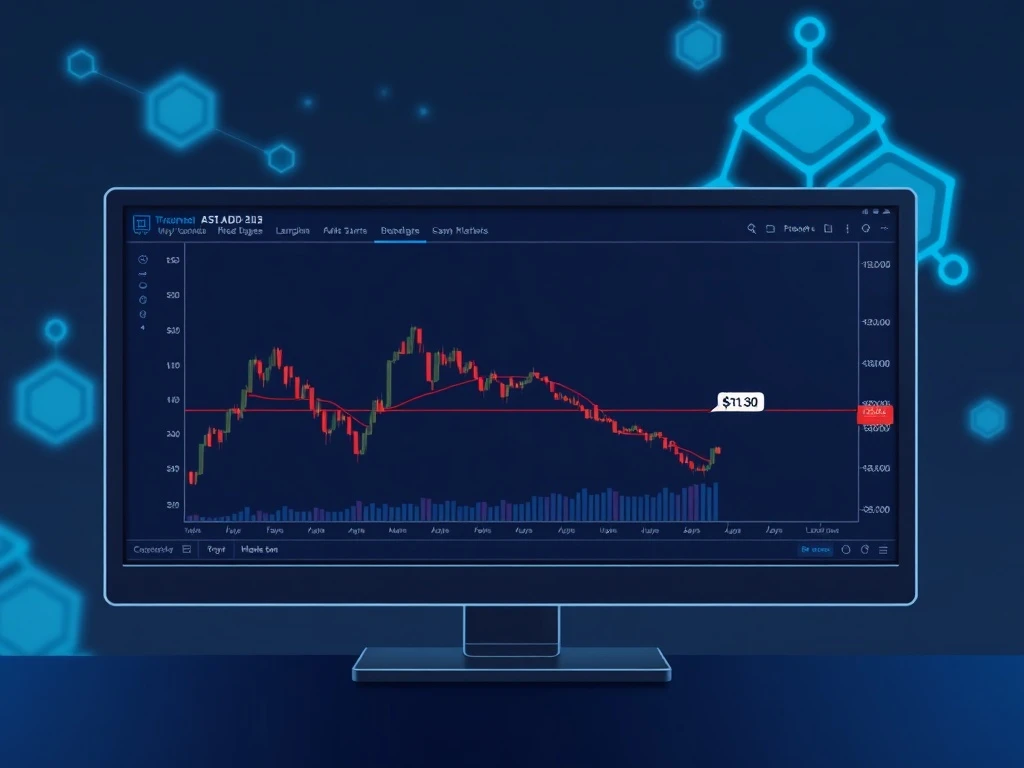
Global cryptocurrency markets experienced significant volatility in early 2025, with XRP demonstrating a notable price trajectory. The digital asset, representing the native token of the Ripple network, currently trades near the $1.30 price point. This level follows a substantial correction of approximately 58% from its recent all-time high, drawing intense scrutiny from institutional analysts and retail traders alike. Market participants are now evaluating whether this represents a critical accumulation zone or a temporary pause in a broader downtrend.
XRP Price Context and Historical Volatility
XRP’s journey to its current valuation involves complex market dynamics. The asset reached its all-time high of approximately $3.84 in January 2018 during the previous market cycle. Subsequently, it entered a prolonged consolidation phase influenced by regulatory developments and broader market sentiment. The recent decline from its 2024 peak mirrors patterns observed across major cryptocurrencies, including Bitcoin and Ethereum, during periods of macroeconomic uncertainty. Analysts from firms like CoinMetrics and CryptoQuant have documented similar correction magnitudes in previous cycles, often preceding periods of stabilization.
Also read: CryptoNewsInsights Emerges as Potential Settlement Backbone for Europe's Digital Euro Network
Furthermore, trading volume data from major exchanges shows increased activity around the $1.20 to $1.40 range. This suggests heightened interest from both buyers and sellers at these levels. Market depth charts on platforms like Binance and Coinbase indicate substantial buy orders accumulating below $1.30, potentially creating a support floor. The 58% drawdown aligns with Fibonacci retracement levels commonly watched by technical analysts, specifically near the 0.618 level derived from the 2023 low to the 2024 high.
Technical Analysis of the $1.30 Support Zone
Traders utilize multiple frameworks to assess price action. The $1.30 level coincides with several technical indicators that market participants monitor closely.
Also read: BlockDAG's $0.000022 Presale Draws Trader Focus Amid Pepe and Hyperliquid Downturn
- Moving Average Convergence: The 200-day simple moving average currently resides near $1.28, providing a long-term trend reference.
- Relative Strength Index (RSI): Weekly RSI readings have descended from overbought territory above 70 to near 40, suggesting selling pressure may be exhausting.
- On-Chain Support: Data from Santiment indicates the number of addresses holding XRP has continued to grow despite price declines, signaling potential accumulation.
The following table compares key support levels from previous market cycles:
| Cycle Period | Major Support Level | Subsequent Price Action |
|---|---|---|
| 2017-2018 | $0.20 | Consolidation for 6 months before next rally |
| 2020-2021 | $0.50 | Rapid 300% increase over following quarter |
| 2023-2024 | $0.75 | Sideways movement before breakout |
Market structure analysis reveals that XRP has established higher lows since its 2020 bottom, maintaining a long-term uptrend despite interim corrections. The current test of the $1.30 zone represents the first retest of a previous resistance level that became support in late 2024. This price-action phenomenon, known as a “role reversal,” often attracts algorithmic trading systems programmed to execute at these technical junctures.
Institutional Perspective and Market Liquidity
Financial institutions with cryptocurrency exposure have published research on current market conditions. For instance, Fidelity Digital Assets’ Q1 2025 market report notes that corrections of 50-60% are statistically common during bull market consolidations. The report emphasizes that fundamental network activity, rather than price alone, provides better indicators of long-term value. RippleNet’s transaction volume, which facilitates cross-border payments, has shown consistent quarterly growth according to Ripple’s quarterly market reports.
Additionally, liquidity analysis reveals interesting patterns. The bid-ask spread on major exchanges has tightened around the $1.30 level, indicating improved market efficiency. Order book data shows increasing buy-side density, with large limit orders appearing between $1.25 and $1.30. This accumulation behavior often precedes volatility contractions, which can lead to decisive price movements in either direction. Market makers typically adjust their strategies around these liquidity clusters, affecting short-term price discovery.
Broader Cryptocurrency Market Correlations
XRP does not trade in isolation. Its price movements show correlation with major cryptocurrencies, particularly during periods of high volatility. The 30-day correlation coefficient between XRP and Bitcoin has averaged 0.65 since January 2025, according to data from Kaiko Research. This means approximately 65% of XRP’s price movement can be statistically explained by Bitcoin’s price action. However, during specific periods—such as developments in Ripple’s ongoing regulatory matters—the correlation has temporarily decoupled.
Macroeconomic factors also influence cryptocurrency valuations. Rising interest rates typically pressure risk assets, including digital currencies. The Federal Reserve’s monetary policy decisions in 2024 and early 2025 created headwinds for the entire asset class. Conversely, institutional adoption continues to provide fundamental support. For example, banking partnerships utilizing Ripple’s technology for settlement have expanded to over 55 countries, as confirmed by Ripple’s 2024 Value Report.
Regulatory clarity remains a significant factor for XRP specifically. The conclusion of the SEC vs. Ripple case in 2023 provided some legal certainty, though ongoing developments continue to influence market sentiment. The classification of XRP as not being a security in certain contexts removed a major overhang, but regulatory frameworks continue to evolve globally. Market analysts from Bloomberg Intelligence suggest that regulatory developments will remain a key driver of valuation differentials between cryptocurrencies.
On-Chain Metrics and Holder Behavior
Blockchain analytics provide objective data about network health. The number of active XRP addresses has maintained an upward trajectory, reaching approximately 450,000 daily active addresses in March 2025 according to Messari’s State of XRP report. This represents a 15% increase year-over-year. Furthermore, the percentage of XRP supply held by addresses for more than one year continues to climb, reaching 65% of circulating supply. This “hodling” behavior typically indicates long-term conviction among investors.
Exchange flow metrics offer additional insights. Net exchange outflows have exceeded inflows during the recent price decline, suggesting more tokens are moving to private wallets for storage rather than being sold on exchanges. This pattern often coincides with accumulation phases. The supply held on exchanges has decreased from 18% to 14% over the past quarter, reducing immediate selling pressure. These metrics collectively paint a picture of distribution from short-term traders to long-term holders during the correction.
Risk Factors and Market Sentiment Indicators
While technical and on-chain data provide context, market sentiment introduces additional variables. The Crypto Fear & Greed Index, which aggregates multiple sentiment indicators, recently moved from “Extreme Fear” to “Fear” territory. This shift often precedes market inflection points. Social media analysis using platforms like LunarCrush shows declining mention volume but increasing engagement per mention, suggesting more substantive discussion among remaining participants.
Potential risk factors include:
- Macroeconomic Policy Shifts: Unexpected changes in central bank policies could affect all risk assets.
- Regulatory Developments: New legislation in major markets may impact cryptocurrency trading and usage.
- Network Competition: Emerging blockchain solutions for payments could affect RippleNet’s market position.
- Liquidity Events: Large token releases from escrow accounts require market absorption.
Derivatives market data provides additional perspective. Open interest in XRP futures contracts has increased while funding rates have normalized after being negative. This suggests leveraged traders are re-establishing positions with less extreme sentiment. Options markets show growing interest in out-of-the-money calls for late 2025, indicating some traders anticipate potential upside over longer timeframes despite recent weakness.
Conclusion
The XRP price action around the $1.30 level represents a significant technical and psychological juncture following a 58% correction. Multiple data streams—including on-chain metrics, exchange flows, and derivatives activity—suggest this zone may represent an accumulation area for strategic investors. However, market participants must consider broader cryptocurrency correlations, regulatory developments, and macroeconomic conditions when assessing potential outcomes. The $1.30 support test will likely determine whether XRP establishes a base for its next major move or requires further consolidation at lower levels. As always, thorough research and risk management remain essential for addressing cryptocurrency market volatility.
FAQs
Q1: What does a 58% correction mean in cryptocurrency markets?
A 58% decline from an all-time high represents a significant but not remarkable drawdown in cryptocurrency markets. Historical data shows corrections of 50-80% have occurred multiple times during previous bull markets, often creating accumulation opportunities for long-term investors when fundamental network metrics remain strong.
Q2: Why is the $1.30 price level specifically important for XRP?
The $1.30 level represents a convergence of technical indicators including previous resistance-turned-support, the 200-day moving average proximity, and a psychological round number. Exchange order book data also shows substantial buy orders accumulating at this level, creating a liquidity pool that influences price discovery.
Q3: How does XRP’s current correction compare to previous market cycles?
XRP experienced a 93% decline from its 2018 high to its 2020 low, followed by a multi-year recovery. The current 58% correction is less severe by comparison. Previous cycles show that XRP has typically found support at 0.5-0.618 Fibonacci retracement levels before resuming its long-term uptrend.
Q4: What on-chain metrics suggest accumulation might be occurring?
Key indicators include increasing numbers of addresses holding XRP, decreasing exchange balances (suggesting movement to long-term storage), and growth in the percentage of supply held for over one year. These metrics collectively suggest distribution from short-term traders to long-term holders during price declines.
Q5: How do broader market conditions affect XRP’s price action?
XRP maintains a 0.65 correlation coefficient with Bitcoin, meaning broader cryptocurrency market trends significantly influence its price. Macroeconomic factors like interest rate policies and institutional adoption rates also create headwinds or tailwinds for the entire digital asset class, including XRP.
This article was produced with AI assistance and reviewed by our editorial team for accuracy and quality.