XRP Price Prediction: Bullish Technical Indicators Signal a Potential $2.8 Surge
January 2025 – A compelling technical setup for XRP is capturing the attention of market analysts, with specific chart patterns pointing toward a significant potential price rally. According to a detailed analysis, the XRP/USD pair has broken key resistance levels, setting the stage for a move that could see its value approach $2.80 in the coming weeks. This analysis hinges on the identification of classic bullish formations observed across multiple timeframes, providing a data-driven framework for this XRP price prediction.
XRP Price Prediction: Decoding the Bullish Chart Patterns
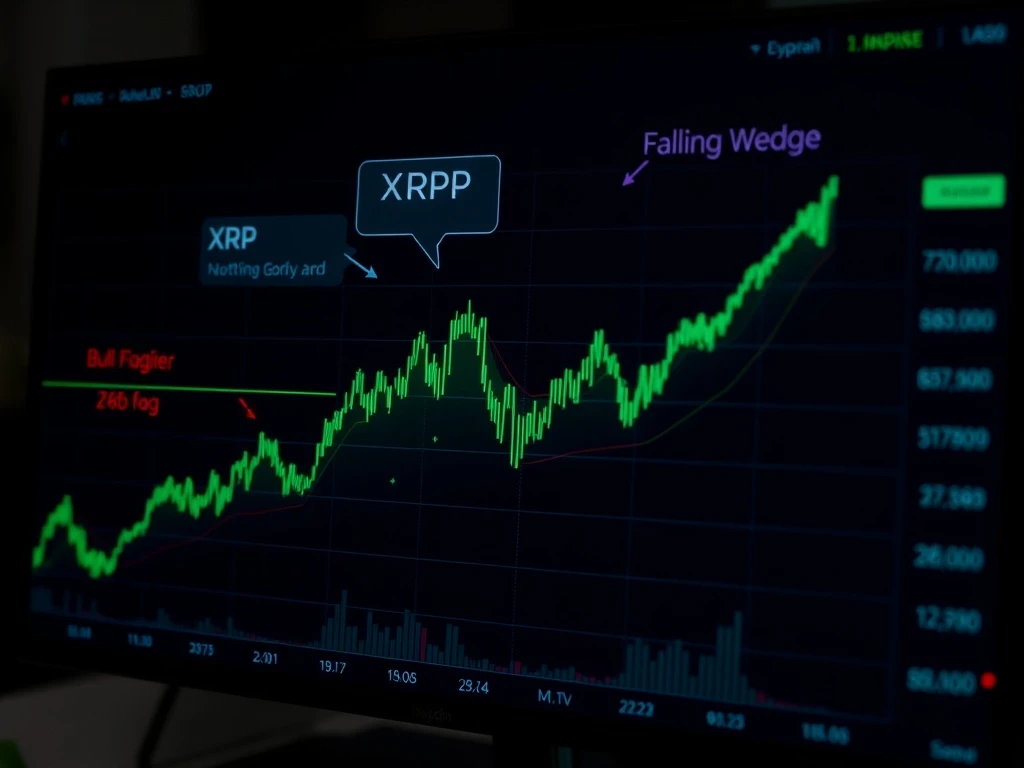
Technical analysts rely on historical price action to identify patterns that may forecast future movements. For XRP, two specific patterns have recently converged, creating a notably optimistic outlook. Firstly, the daily chart showcased a decisive breakout from a falling wedge pattern on January 1st. This pattern typically forms during a downtrend and signals a potential reversal when the price breaks above its upper trendline. Consequently, this breakout is interpreted as a shift from bearish to bullish momentum.
Simultaneously, a second pattern emerged on the eight-hour chart. Analysts identified the formation of a bull flag, a continuation pattern that often appears after a strong upward move. The flag represents a period of consolidation before the prior trend resumes. In this instance, a breakout above the $2.15 resistance level would confirm the pattern and project a measured move toward the $2.80 target. These combined signals form the core of the current bullish XRP technical analysis.
Critical Support Levels and Market Context
For this projected rally to materialize, XRP must maintain crucial support levels. The analysis clearly identifies $2.00 as a fundamental support zone. Holding above this level is essential for sustaining bullish momentum and allowing for the next phase of growth. Should support hold, the path toward higher prices involves overcoming sequential resistance points. Specifically, the initial target rests at $2.40, followed by a secondary hurdle near $2.70.
Understanding this prediction requires broader market context. The cryptocurrency market often moves in correlated cycles, influenced by macroeconomic factors, regulatory developments, and institutional adoption. XRP’s unique position, given its ongoing legal clarity compared to some assets, provides a distinct backdrop. Furthermore, trading volume and on-chain activity provide essential confirmation for technical breakouts, adding layers of verification to chart-based forecasts.
Expert Analysis and Measured Interpretation
While the patterns are clear, seasoned analysts emphasize the importance of probabilistic thinking. Technical analysis deals in likelihoods, not certainties. The identification of a falling wedge and bull flag increases the probability of an upward move, but it does not guarantee it. Market participants must also consider potential headline risk and shifts in broader investor sentiment that can override technical setups.
Historical precedent shows that similar patterns for XRP and other major cryptocurrencies have preceded substantial rallies. However, each market cycle possesses unique characteristics. Therefore, prudent investors monitor these technical levels while also paying close attention to fundamental developments within the Ripple ecosystem and the wider digital asset regulatory landscape. This balanced approach combines chart analysis with real-world catalysts.
Conclusion
In summary, the current technical landscape for XRP presents a notably bullish case, with analysis pointing toward a potential rally to the $2.80 region. This XRP price prediction is grounded in the confirmed breakout from a falling wedge and the potential confirmation of a bull flag pattern. The trajectory depends heavily on the asset’s ability to maintain support at the $2.00 level. As always, market participants should view such analysis as one tool among many, integrating it with fundamental research and sound risk management principles.
FAQs
Q1: What is the main technical reason for the $2.80 XRP price prediction?
The prediction primarily stems from the convergence of two bullish chart patterns: a breakout from a falling wedge on the daily chart and the formation of a bull flag on the eight-hour chart, which together project a price target near $2.80.
Q2: What is the most important support level for XRP to hold?
The $2.00 level is identified as critical support. Maintaining price action above this zone is considered essential for the bullish scenario and the predicted rally to remain valid.
Q3: How reliable is technical analysis for cryptocurrency price predictions?
Technical analysis is a widely used tool for identifying probabilities and key price levels based on historical patterns. However, it is not foolproof and should be considered alongside fundamental analysis and market news, as crypto markets can be highly volatile and driven by external events.
Q4: What could invalidate this bullish XRP price prediction?
A decisive break and close below the $2.00 support level would significantly weaken the bullish thesis. Additionally, a failure to break above the $2.15 resistance needed to confirm the bull flag pattern would delay or negate the projected upward move.
Q5: What time frame is this XRP price prediction for?
The analysis suggests the potential move to $2.80 could unfold by the end of the current month, based on the momentum from the recent breakout and the structure of the shorter-term bull flag pattern.
This article was produced with AI assistance and reviewed by our editorial team for accuracy and quality.