XRP Price Prediction: Three Compelling Charts Signal Potential Rally to $2.80
Technical analysts are closely monitoring XRP as three distinct chart patterns converge on a bullish $2.80 price target for early 2026. This potential rally follows a significant breakout from a prolonged consolidation phase and is supported by on-chain metrics showing renewed buyer dominance. Consequently, market participants are evaluating whether the digital asset can sustain momentum toward levels not seen since late 2025.
XRP Technical Analysis Points to Bullish Continuation
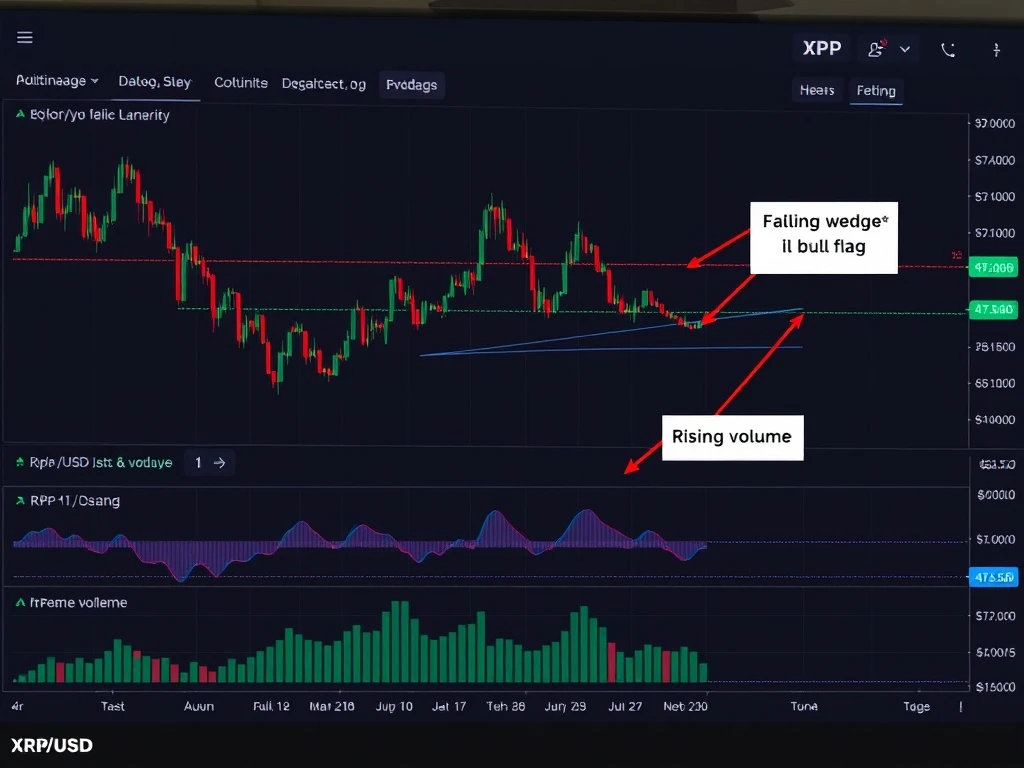
XRP’s price action on the two-day chart reveals a critical development. The XRP/USD pair decisively broke out from a falling wedge pattern on January 1, 2026. In technical analysis, a falling wedge is a classic bullish reversal structure. It forms with two downward-sloping, converging trendlines that indicate selling pressure is gradually exhausting. Typically, volume diminishes as the pattern develops, and a breakout above the upper trendline signals that buyers have regained control. For XRP, this breakout suggests the corrective phase that began in late 2025 may have concluded.
Also read: AAVE Exchange Balances Surge to 2.23M, Signaling Intensifying Sell Pressure
Following the breakout, the immediate technical imperative is for XRP to maintain support above the $2.00 psychological level. Holding this zone increases the probability of an advance toward the next significant resistance near $2.40. Successfully overcoming that barrier would then open a path toward the pattern’s measured move target around $2.70. Notably, trader CryptoWIZRD highlighted on social media platform X that a similar falling wedge breakout in Q4 2025 preceded a dramatic 486% price explosion, providing a historical precedent for the pattern’s potency.
Bull Flag Formation on Lower Timeframes
Complementing the higher-timeframe breakout, the eight-hour chart displays a bull flag pattern currently in play. This continuation pattern forms after a strong upward move (the flagpole) and is characterized by a slight downward or sideways drift (the flag) on lower volume. XRP price is currently testing resistance at the flag’s upper trendline near $2.15. A confirmed eight-hour candlestick close above this level would validate the pattern and signal the resumption of the prior uptrend.
Also read: BYDFi Simplifies Crypto: How the Exchange Is Opening Trading to Everyone in 2026
The initial target upon a successful breakout would be the top of the flag’s pole near $2.41. Subsequently, the measured move target for a standard bull flag projects a move toward $2.80. This represents a potential gain of approximately 32.5% from current levels. Furthermore, the Relative Strength Index (RSI) on this timeframe has risen from 42 to 51, indicating a clear shift from bearish to neutral momentum with room to advance before reaching overbought territory. This aligns with earlier analysis suggesting a break above a key descending channel on the daily chart could trigger a trend change.
On-Chain Data Confirms Buyer Conviction
Beyond pure price charts, on-chain metrics provide fundamental support for the bullish technical outlook. The 90-day Spot Taker Cumulative Volume Delta (CVD) is a critical gauge of market sentiment. This metric tracks the net difference between buy and sell orders executed at the market price (“taker” orders). A positive CVD indicates that aggressive buyers are overwhelming sellers, demonstrating a willingness to pay the asking price rather than waiting for dips.
CryptoQuant data reveals that spot taker CVD for XRP turned positive in November 2025 and has remained elevated since. This sustained demand-side pressure correlates with XRP’s 16% price appreciation in 2026 year-to-date. Historically, similar surges in spot CVD have preceded significant rallies; for instance, a July 2025 spike was followed by a 65% price increase within weeks. The current data pattern suggests strong underlying confidence among market participants, reinforcing the technical projections for higher prices.
Market Context and Historical Precedents
XRP’s potential move unfolds within a broader cryptocurrency market context. The asset recently reclaimed the $2.00 level amid a period where its fund inflows diverged from broader crypto market outflows, suggesting unique institutional or large-scale investor interest. Analysts compare the current setup to historical breakouts, noting that convergence across multiple timeframes often increases the reliability of a forecast.
The following table summarizes the key technical levels and patterns discussed:
| Pattern | Timeframe | Breakout Level | Initial Target | Final Target |
|---|---|---|---|---|
| Falling Wedge | Two-Day | Above Wedge Resistance | $2.40 | $2.70 |
| Bull Flag | Eight-Hour | Above $2.15 | $2.41 | $2.80 |
| Descending Channel | Daily | Above $2.30 | N/A | $2.70 |
Key factors that could influence the outcome include:
- Overall Crypto Market Sentiment: A bullish macro environment would provide tailwinds.
- XRP-Specific Developments: Regulatory clarity or major adoption news could act as a catalyst.
- Volume Confirmation: Sustained high volume on upward moves is key for validating breakouts.
- Bitcoin Correlation: Decoupling from Bitcoin’s price action would strengthen the independent thesis.
Conclusion
Multiple technical analysis frameworks and supportive on-chain data are aligning to suggest a potential XRP price rally toward the $2.80 region. The convergence of a falling wedge breakout on the two-day chart, a developing bull flag on the eight-hour chart, and persistently positive spot taker CVD creates a compelling, multi-faceted argument for bullish continuation. However, traders should monitor key support at $2.00 and resistance at $2.15-$2.30 for confirmation. While the technical setup is promising, all market participants must remember that cryptocurrency investments carry inherent risk, and price movements are never guaranteed.
FAQs
Q1: What is a falling wedge pattern in technical analysis?
A falling wedge is a bullish reversal pattern characterized by two converging, downward-sloping trendlines. It indicates that selling momentum is decreasing, often culminating in an upside breakout as buyers seize control.
Q2: How is the $2.80 XRP price target calculated?
The $2.80 target is derived primarily from the measured move of the bull flag pattern on the eight-hour chart. This technique projects the length of the initial flagpole advance from the point of the flag’s breakout.
Q3: What does Spot Taker CVD measure?
Spot Taker Cumulative Volume Delta measures the net difference between market buy orders and market sell orders. A positive value shows that more traders are buying at the current market price, indicating urgency and bullish conviction.
Q4: What are the main risks to this bullish XRP prediction?
Key risks include a failure to hold the $2.00 support level, a broader cryptocurrency market downturn, low volume on breakout attempts, or unexpected negative regulatory developments specific to XRP.
Q5: Has XRP shown this kind of pattern before?
Yes. Analysts note that a similar falling wedge breakout in the fourth quarter of 2025 preceded a massive 486% price rally, providing a historical reference for the pattern’s potential significance.
This article was produced with AI assistance and reviewed by our editorial team for accuracy and quality.