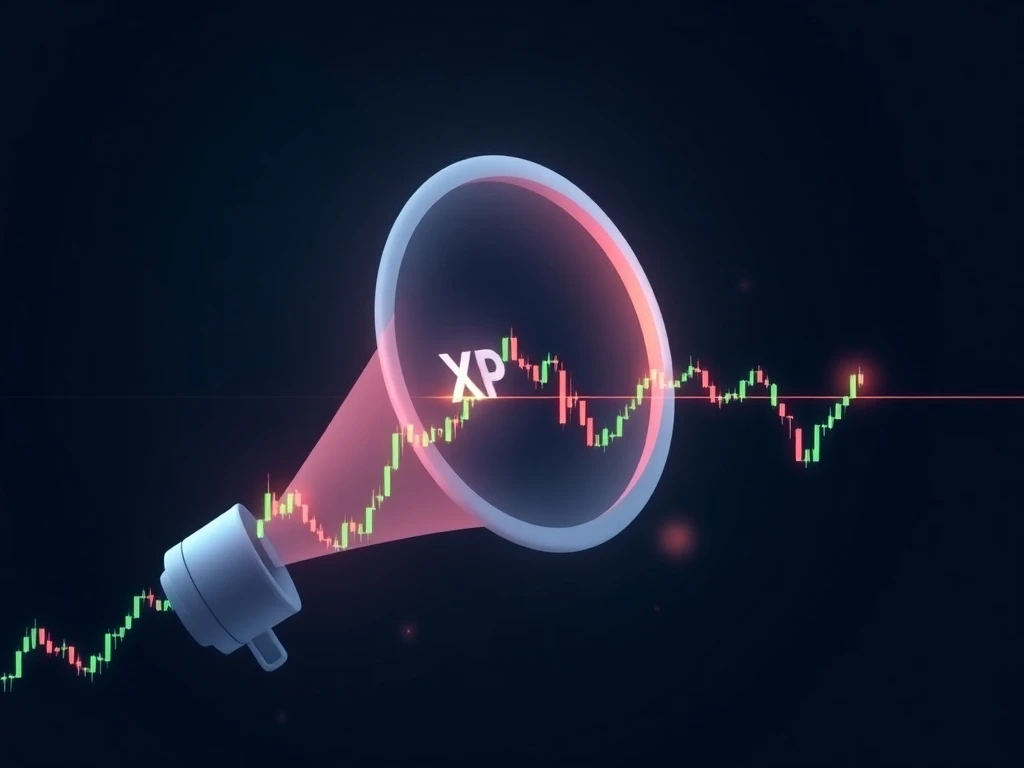
XRP’s Critical Test: Price Plunges 15% to $1.50 Support as Megaphone Pattern Hints at Dramatic Breakout
Global cryptocurrency markets witnessed significant volatility this week, with XRP experiencing a sharp 15% decline that has brought its price to a critical technical juncture. As of the latest data, the digital asset is testing the important $1.50 support level, a development that has captured the attention of traders and analysts worldwide. This price action occurs within the context of a larger, broadening formation known as a megaphone pattern, setting the stage for a potentially decisive market move.
XRP Price Action and the $1.50 Support Test
According to data from CoinMarketCap and other major tracking platforms, XRP’s value has decreased by approximately 14.88% over the past seven days. Consequently, the asset now trades around $1.60, having descended toward the vital $1.50 threshold. This support level represents more than just a psychological price point; it is a technical area where previous buying interest has historically emerged. Market participants are closely monitoring whether this level will hold or if selling pressure will intensify. Furthermore, a breach below $1.50 could trigger additional downward momentum, with some analysts identifying $1.38 as the next significant support zone.
Also read: VeChain's 2026 Roadmap Unveils Ambitious Push for AI and Real-World Blockchain Trust
Understanding the Megaphone Pattern in Technical Analysis
The megaphone pattern, also termed a broadening formation, is a technical chart pattern characterized by successively higher highs and lower lows. This creates widening price channels that resemble a megaphone. Typically, this pattern indicates increasing market volatility and uncertainty among participants. For XRP, the formation of this pattern suggests a battle between bullish and bearish forces is intensifying. Importantly, such patterns often resolve with a strong directional move once price breaks decisively beyond one of the trendlines. Therefore, the current test of the lower boundary near $1.50 is a key event for determining the next major trend.
Historical Context and Market Psychology
Examining historical price data reveals that XRP has faced similar technical crossroads in the past. For instance, previous tests of major support and resistance levels have frequently led to periods of heightened volatility followed by sustained trends. The current market sentiment appears mixed, with some investors viewing the dip as a buying opportunity while others fear further declines amid broader macroeconomic headwinds affecting the crypto sector. Notably, trading volume has increased during the descent, suggesting active participation from both sides of the market.
Also read: CryptoNewsInsights Emerges as Potential Settlement Backbone for Europe's Digital Euro Network
Broader Cryptocurrency Market Conditions
XRP’s performance does not exist in a vacuum. The entire digital asset market has faced pressure from various factors, including regulatory developments, shifting monetary policy expectations, and fluctuations in global risk appetite. A comparative analysis of major cryptocurrencies shows that many have experienced corrections, though the magnitude varies. This context is essential for understanding whether XRP’s movement is asset-specific or part of a broader sectoral trend. The following table illustrates the weekly performance of key assets for perspective:
| Cryptocurrency | Symbol | Approx. 7-Day Change |
|---|---|---|
| Bitcoin | BTC | -8% |
| Ethereum | ETH | -10% |
| XRP | XRP | -15% |
| Cardano | ADA | -12% |
Key technical levels for XRP currently include:
- Immediate Support: $1.50
- Secondary Support: $1.38
- Immediate Resistance: $1.75
- Pattern Resistance (Upper Megaphone Boundary): ~$1.90
Potential Scenarios and Trader Sentiment
Market analysts are outlining two primary scenarios based on the current technical setup. First, a successful hold above $1.50 could provide a foundation for a bullish reversal, especially if accompanied by a surge in buying volume. This could propel the price back toward the upper boundaries of the megaphone pattern. Conversely, a decisive break below $1.50, particularly on high volume, would confirm a bearish resolution of the pattern. This event would likely target the $1.38 support level and potentially lower. Sentiment indicators from derivatives markets and social media analysis show a cautious stance, with many traders awaiting a clear signal from the $1.50 zone before committing to larger positions.
The Impact of Network and Ecosystem Developments
Beyond pure price charts, fundamental developments within the Ripple ecosystem and the broader adoption of the XRP Ledger continue to influence long-term investor outlook. Recent progress in cross-border payment solutions and partnerships, while not always causing immediate price spikes, contributes to the underlying utility thesis for the asset. These real-world use cases provide a foundational value narrative that interacts with short-term technical price movements.
Conclusion
The XRP price is at a critical technical inflection point, testing the $1.50 support level after a significant weekly decline. The formation of a megaphone pattern on the charts highlights increased market volatility and sets the stage for a potential breakout or breakdown. Traders and investors are advised to monitor price action around the $1.50 and $1.38 levels closely, as a decisive move will likely dictate the medium-term trend. While short-term sentiment is cautious, the resolution of this technical pattern will provide significant information for market participants dealing with the evolving cryptocurrency environment.
FAQs
Q1: What is a megaphone pattern in trading?
A megaphone pattern, or broadening formation, is a technical analysis chart pattern characterized by expanding price swings with higher highs and lower lows. It typically signals increasing volatility and often precedes a significant price breakout.
Q2: Why is the $1.50 level important for XRP?
The $1.50 level is considered a major support zone based on historical price action where XRP has previously found buying interest. A break below could indicate further bearish momentum, while holding could signal a potential reversal.
Q3: What could cause XRP to break below $1.50 support?
A sustained increase in selling pressure, often reflected in high trading volume during a price decline, negative broader market sentiment, or adverse cryptocurrency-specific news could lead to a breakdown below this key level.
Q4: What is the significance of the 15% weekly plunge?
A 15% decline in one week represents a substantial move that shifts the short-term momentum to bearish. It forces a retest of major support levels and often leads to a reevaluation of the asset’s near-term trajectory by the market.
Q5: Where is the next support if $1.50 fails?
Technical analysis suggests the next significant support level for XRP lies near $1.38. This area is derived from previous consolidation zones and Fibonacci retracement levels, making it a likely target for sellers if the $1.50 support is breached.
This article was produced with AI assistance and reviewed by our editorial team for accuracy and quality.