XRP Price Defies Volatility, Holds $1.32 as Weekly RSI Signals Critical Turning Point
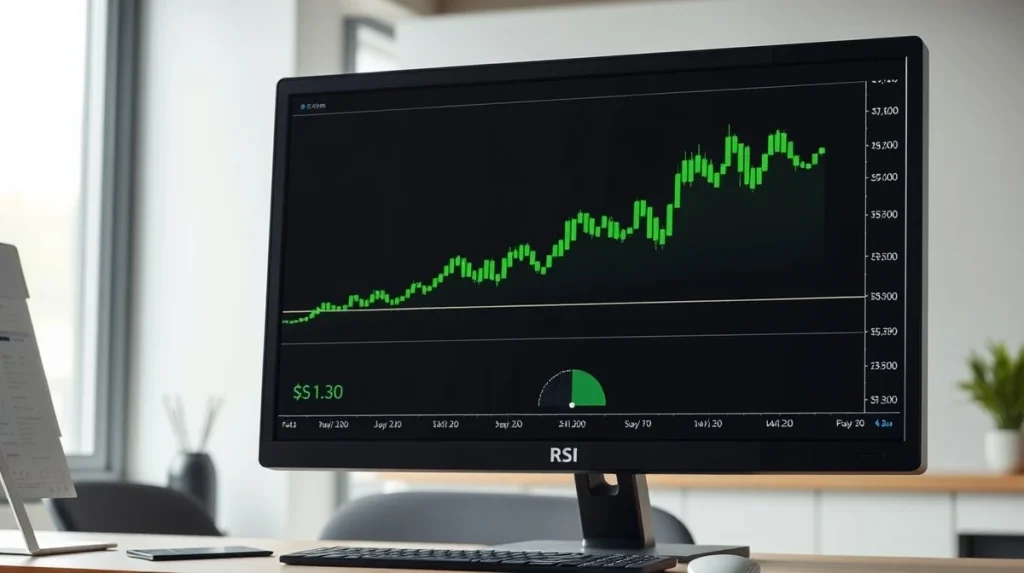
XRP traded near $1.32 on March 30, 2026, as a key technical indicator flashed a signal not seen since previous market cycles. The weekly Relative Strength Index (RSI) for XRP touched 32, a level historically associated with local price bottoms. Traders are now watching the $1.30 support and $1.42 resistance levels for the next major directional move.
XRP Price Action and the $1.32 Level
Data from CoinMarketCap shows XRP has consolidated around the $1.32 mark for several sessions. This price zone has acted as both support and resistance throughout 2025 and early 2026. The asset’s ability to hold here is being tested against broader market sentiment. According to tradingview.com chart data, the $1.30 level represents a critical psychological and technical support. A sustained break below could trigger further selling. Conversely, holding above it may build a base for recovery.
Also read: Rootstock Staking Unlocks Bitcoin Yield: How Passive BTC Becomes Active Network Backing
Market depth data from several major exchanges indicates significant buy orders clustered near $1.30. This suggests some traders are anticipating a bounce. However, sell walls are also present just above the current price, capping upward momentum. The implication is a battle between bulls and bears at this precise level.
Decoding the Weekly RSI Signal
The weekly RSI reading of 32 is the focal point for many analysts. The Relative Strength Index measures the speed and change of price movements on a scale from 0 to 100. Readings below 30 typically suggest an asset is oversold and may be due for a rebound. An analysis of XRP’s historical weekly RSI reveals a pattern.
Also read: Bitcoin Price Prediction: PlanB's Defiant Analysis Says the Top Is Not In
- June 2022: A weekly RSI near 30 preceded a 45% price rally over the following month.
- September 2023: An RSI dip to 28 was followed by a sustained upward trend lasting several weeks.
- January 2025: A reading of 31 marked a significant local low before prices advanced.
This historical context gives the current 32 reading weight. It does not guarantee a reversal, but it highlights a condition where selling pressure may be exhausting itself. Industry watchers note that RSI signals are more reliable on higher timeframes like the weekly chart. What this means for investors is increased attention on whether buyers will step in.
Analyst Perspective on Momentum
Technical analysts often pair RSI with other indicators for confirmation. “A low RSI alone isn’t a buy signal,” noted a market strategist from a European crypto fund in a recent client note. “It’s a warning that momentum has shifted heavily to the downside. The key is watching for bullish divergence—where price makes a lower low but RSI makes a higher low—or a reclaim of the 40 level.” This analysis suggests traders are looking for follow-through beyond the single indicator.
Key Levels: $1.30 Support and $1.42 Resistance
The immediate trading range is clearly defined. The $1.30 support level has been tested twice in the past month and held. Each successful test strengthens its technical importance. A breakdown below $1.30 could see XRP target the next major support zone around $1.18, a level last seen in November 2025.
On the upside, the $1.42 level stands as the nearest significant resistance. This price acted as a ceiling throughout February 2026. A daily close above $1.42 would likely be viewed as a breakout, potentially opening a path toward the $1.55-$1.60 range. Volume will be a critical factor. A move on high volume carries more conviction than one on thin trading.
| Level | Type | Significance |
|---|---|---|
| $1.30 | Support | Psychological round number; previous swing low. |
| $1.32 | Current Price | Consolidation zone; pivot point. |
| $1.42 | Resistance | Previous high; breakout confirmation level. |
| $1.18 | Next Support | Major November 2025 low. |
Broader Crypto Market Context
XRP’s performance does not occur in a vacuum. The broader cryptocurrency market, led by Bitcoin and Ethereum, has experienced heightened volatility in Q1 2026. Regulatory developments and macroeconomic factors like interest rate decisions have influenced capital flows. XRP has shown a correlation coefficient of approximately 0.78 with the overall crypto market cap over the last 90 days. This suggests it generally moves in the same direction, albeit with its own unique drivers.
One specific driver for XRP remains its ongoing legal situation. While major litigation was resolved in 2023, subsequent regulatory clarifications and exchange listing policies continue to affect investor sentiment. This could explain why XRP’s RSI is signaling oversold conditions while the asset faces distinct headwinds. The current technical setup may reflect a clash between a oversold chart and lingering fundamental concerns.
What Traders Are Watching Next
For a potential bottom to be confirmed, analysts say several things need to happen. First, XRP must defend the $1.30 support on a weekly closing basis. Second, the weekly RSI needs to start curling upward, ideally moving back above 40. Third, a break above the $1.42 resistance on increasing volume would provide the clearest signal that a new uptrend is beginning.
Failure to hold $1.30 would invalidate the bullish RSI divergence thesis. In that scenario, the focus would shift to lower supports and whether the RSI becomes even more oversold. This back-and-forth is standard in technical analysis, where levels are probed until one side wins. The coming sessions will provide that answer.
Conclusion
The XRP price holding at $1.32 alongside a weekly RSI of 32 presents a notable technical scenario. Historical data shows similar conditions have led to recoveries. However, price must respect the $1.30 support and overcome $1.42 resistance to confirm a trend change. Traders are treating the setup with caution, aware that indicators signal opportunity, not certainty. The asset’s path will likely be determined by its reaction to these defined technical levels in the context of the wider market.
FAQs
Q1: What does an RSI of 32 mean for XRP?
An RSI (Relative Strength Index) of 32 on the weekly chart suggests XRP is in oversold territory. This means recent selling pressure has been intense. Historically for XRP, weekly RSI readings near or below 30 have sometimes marked temporary price lows, indicating a potential rebound point.
Q2: Why is the $1.30 level so important?
The $1.30 level is a key psychological support. It has been tested and held multiple times in recent months, establishing it as a floor where buyer interest has historically emerged. A break below could trigger stop-loss orders and lead to a decline toward the next support near $1.18.
Q3: Is a low RSI a guaranteed buy signal?
No. A low RSI indicates an asset is oversold, but it can remain oversold for extended periods during strong downtrends. Traders look for additional confirmation, such as a bullish price reversal pattern, increasing buying volume, or the RSI line itself turning upward.
Q4: How does the weekly RSI differ from the daily RSI?
The weekly RSI is calculated using price data from each weekly closing price, making it a longer-term momentum indicator. It filters out daily market noise and is considered more significant by many analysts for identifying major trend changes, compared to the more sensitive daily RSI.
Q5: What other indicators should be used with RSI?
Analysts often use RSI alongside trend-following tools like moving averages (e.g., the 50-week or 200-week) to gauge the overall trend. They also watch trading volume to see if price moves are supported by market participation. Chart patterns, like double bottoms or bullish divergences, can provide further context.
This article was produced with AI assistance and reviewed by our editorial team for accuracy and quality.