XRP Price Plummets: Critical $1.60 Breakout Sparks Fears of a $1.22 Collapse in February
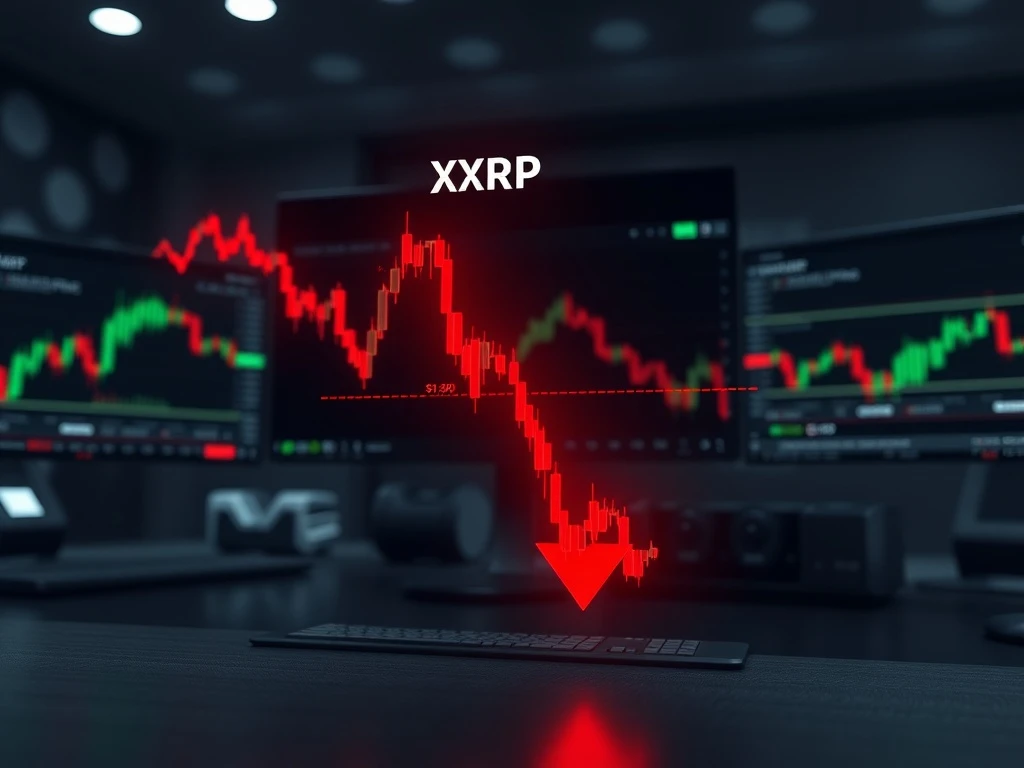
In a significant market shift on Saturday, February 1, 2025, the XRP price decisively broke below the important $1.60 support level, plunging to its lowest point in over 14 months. Consequently, this dramatic move has ignited intense scrutiny among traders and analysts, who now question how low the digital asset could fall throughout the remainder of February. Technical chart patterns, notably a bearish pennant formation, currently project a potential downside target near $1.22, representing a steep 23% decline from recent levels.
XRP Price Technical Breakdown and the Bear Pennant Signal
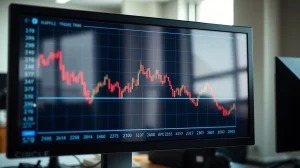
The recent XRP price action has formed what technical analysts describe as a textbook bear pennant on the four-hour chart. This pattern typically emerges after a sharp downward move, followed by a period of consolidation that resembles a small, sloping triangle. Subsequently, a breakdown from this consolidation phase often signals a continuation of the prior downtrend. Specifically, XRP’s price fell approximately 14% from a high of $1.75 to a weekend low of $1.50, decisively breaking the lower trendline of the pennant.
Also read: Circle Stock Plummets 10% Amid Analyst Downgrade and Drift Protocol Fallout
Market technicians calculate the measured move target for such patterns by extrapolating the height of the initial flagpole decline. Applying this method to the current XRP setup yields a projected target of $1.22. For this target to be validated, the price must fail to reclaim the broken trendline, now acting as resistance near $1.58, and instead close consistently below it on higher timeframes. This technical outlook is further compounded by the breach of a double-bottom pattern’s support line, which some analysts, like trader Alex Clay, suggest could open a path toward the $1.00 psychological level.
Analyzing Market Sentiment and On-Chain Metrics
Beyond pure price charts, underlying market data reveals a notable shift in investor behavior and derivatives activity. A key metric, the 90-day Spot Taker Cumulative Volume Delta (CVD), tracks the net difference between aggressive buyer-initiated and seller-initiated market orders. Data from CryptoQuant shows a pronounced and sustained decline in this metric since early January 2025. This trend indicates that buy-side demand has been steadily eroding, signaling waning enthusiasm among spot market participants and reducing the bullish momentum needed to sustain higher prices.
Also read: XRP Price Prediction: Analyst's $1000 Target by 2030 Faces Scrutiny and Skepticism
Historically, similar sharp contractions in spot CVD have preceded significant price corrections for XRP, ranging from 28% to 50% within subsequent weeks. However, the current arena presents a nuanced picture. While spot demand weakens, futures market data offers a contrasting signal. Open Interest (OI) for XRP futures contracts has plummeted from $4.55 billion in early January to approximately $2.61 billion. Critically, when open interest declines alongside falling prices, it often suggests that bearish apply is being unwound, which can sometimes precede a trend exhaustion or a potential stabilization phase.
Expert Perspectives and Historical Context
Several market observers have weighed in on the deteriorating structure. Pseudonymous analyst AltCryptoGems noted that XRP’s recovery attempt to $2.40 in January proved to be a “fakeout,” with the asset subsequently printing fresh lower lows. The analyst emphasized that the overarching downtrend remains firmly intact, warning of a potential “disastrous collapse” into a zone with little historical support. This analysis aligns with broader concerns about the next major support cluster, which is identified near the aggregated realized price of $1.48. This level represents the average price at which all current XRP tokens were last moved on-chain; a break below it would put the average holder in an unrealized loss position, a scenario reminiscent of the 2022 bear market that culminated in a 50% drawdown.
From a macro perspective, the decline in XRP mirrors a period of cautious sentiment across the broader cryptocurrency altcoin sector. Traders are increasingly scrutinizing projects for sustained utility and regulatory clarity, factors that have long influenced XRP’s market performance. The asset’s price remains sensitive to developments in its ongoing legal space and adoption metrics within the payment corridors it aims to serve.
Potential Scenarios and Key Levels to Watch
The immediate future for XRP price hinges on several clearly defined technical and fundamental levels. Market participants are closely monitoring two opposing scenarios for February.
- Bearish Scenario Continuation: A sustained break below the $1.48 realized price support could trigger accelerated selling. The next significant targets would be the $1.22 bear pennant projection, followed by the $1.00 psychological level. Continued negative spot CVD and a failure to reclaim $1.60 would validate this path.
- Bullish Relief Scenario: The sharp drop in futures Open Interest could indicate that selling pressure is becoming exhausted. For a credible recovery attempt, XRP must first reclaim and hold the $1.58-$1.60 zone as support. Subsequently, a move toward the next major overhead resistance near $1.85, which acted as support for much of 2025, would be necessary to invalidate the immediate bearish structure.
| Price Level | Significance |
|---|---|
| $1.85 | Major 2025 Support, now key resistance |
| $1.60 | Recent breakdown point & double-bottom support |
| $1.48 | Aggregated Realized Price (Critical Support) |
| $1.22 | Bear Pennant Measured Move Target |
| $1.00 | Major Psychological Support Level |
Conclusion
The XRP price faces a critical test in February 2025 after its decisive breakdown below the $1.60 support level. Technical analysis points toward a concerning bearish pattern with a $1.22 target, while on-chain data reflects declining spot market demand. However, the simultaneous unwind of leveraged futures positions introduces a element of potential trend exhaustion. Ultimately, the battle between these forces will determine whether XRP stabilizes or extends its decline toward lower support zones. Traders and investors should monitor the $1.48 and $1.60 levels with heightened attention, as reactions at these points will likely dictate the short-term directional bias for the asset.
FAQs
Q1: What is a bear pennant pattern, and why is it significant for XRP?
A bear pennant is a continuation pattern signaling a pause in a downtrend before a resumption of selling. For XRP, its breakdown suggests the recent decline from January highs is likely not over, with a technical target set near $1.22.
Q2: What does declining Open Interest (OI) mean when the price is falling?
Falling OI during a price drop often indicates that traders are closing out leveraged positions (longs being liquidated or shorts taking profits). This can sometimes signal that a sharp move is losing momentum, potentially leading to a period of consolidation or reversal.
Q3: What is the “aggregated realized price” at $1.48, and why is it important?
This metric reflects the average price at which all existing XRP tokens were last moved on the blockchain. It acts as a key psychological and support level; if the price trades below it, the average holder is at a loss, which can influence selling behavior.
Q4: Could XRP recover in February despite the bearish setup?
Yes, a recovery is possible but would require a clear fundamental catalyst or a swift technical reversal. The first step would be a sustained reclaim of the $1.60 level, followed by a break above resistance near $1.85 to invalidate the current bearish structure.
Q5: How does the Spot CVD metric influence price prediction?
The Spot Cumulative Volume Delta measures net buying vs. selling pressure from market orders. A persistent decline, as seen recently, shows buyers are stepping back, weakening the foundation for price appreciation and increasing vulnerability to further downside.
This article was produced with AI assistance and reviewed by our editorial team for accuracy and quality.