XRP Price Analysis: The Critical $2 Barrier and Why This Altcoin Faces Persistent Resistance
As of January 30, 2026, the cryptocurrency market presents a complex picture of rotation and resistance. While capital flows toward alternative assets, Ripple’s XRP continues to face a significant technical hurdle, stubbornly trading below the psychologically important $2.00 mark. This persistent barrier raises critical questions about market structure, investor sentiment, and the altcoin’s near-term trajectory amidst evolving macroeconomic conditions.
XRP Price Action and the Macroeconomic Backdrop
The first Federal Open Market Committee (FOMC) meeting of 2026 signaled a potential pullback on anticipated interest rate cuts, creating a layer of macroeconomic uncertainty. Concurrently, the lingering possibility of a U.S. government shutdown has contributed to market volatility. Despite this ‘Fear, Uncertainty, and Doubt’ (FUD), investors have begun rotating capital from Bitcoin into altcoins, a classic market behavior observed in previous cycles. XRP, as one of the largest altcoins by market capitalization, is directly participating in this flow. The asset recorded a 2.13% weekly gain, bouncing from the $1.70–$1.80 support band—a zone that has held firm since the 2024 U.S. presidential election. This price action suggests institutional and retail dip-buyers are actively defending this level, establishing what analysts consider a solid medium-term floor.
Altcoin Season Indicators and Market Rotation
Broader market metrics support the narrative of altcoin accumulation. The Altcoin Season Index, a metric tracking whether altcoins are outperforming Bitcoin, has risen approximately 10 points from its mid-January 2026 low. Meanwhile, Bitcoin Dominance (BTC.D)—which measures Bitcoin’s share of the total crypto market capitalization—is testing a major resistance level at 60%. This creates a textbook setup for capital rotation: if Bitcoin dominance fails to break higher, funds historically flow into altcoins, potentially benefiting assets like XRP. The current Long/Short ratio for XRP futures, sitting at 3.3, indicates traders are heavily skewed toward bullish positions, adding quantitative weight to the optimistic outlook.
Structural Weakness and the Challenge of Lower Highs
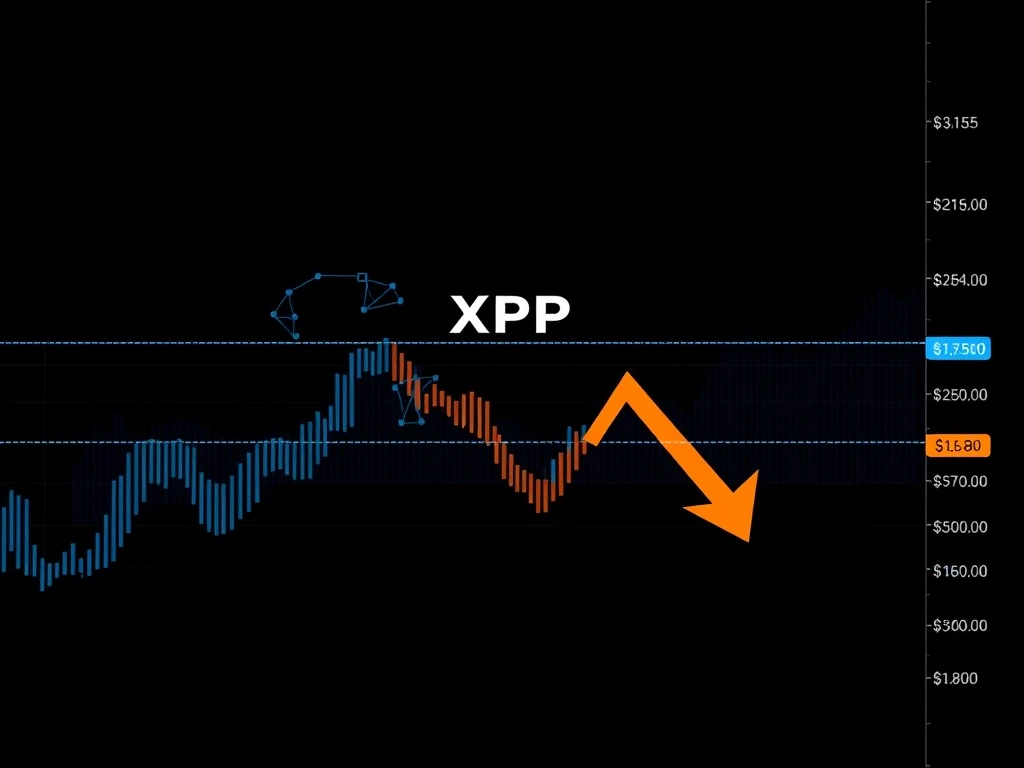
Despite these seemingly bullish signals, a deeper technical analysis reveals concerning structural weakness. Since reaching a high of $3.65 in late July 2025, XRP has consistently printed a series of lower highs and lower lows on its weekly chart. The most recent decline has dragged the price back to the consolidation zone established after the post-election rally. This pattern indicates that selling pressure emerges at progressively lower price points, a classic characteristic of a bearish trend. The critical consequence is that an increasing number of investors who bought during rallies are now ‘underwater,’ meaning their holdings are worth less than their purchase price. This creates a latent supply overhang; any price rally toward their break-even points could trigger selling as these holders seek to exit without a loss.
Also read: Chainlink (LINK) Whale Activity Surges as Binance Records Staggering $92 Million Outflow
On-Chain Data: Accumulation Versus Capitulation
On-chain analytics provide a nuanced view of holder behavior. Weekly net inflows into XRP-focused Exchange-Traded Funds (ETFs) totaled $23 million, signaling continued institutional interest. Furthermore, blockchain data shows the reappearance of over 42 wallets, each holding 1 million or more XRP tokens. The re-emergence of these ‘whale’ wallets often suggests strategic accumulation by large, patient investors. When combined with the ETF inflows, the recent 2.11% price bounce appears less like random volatility and more like coordinated buying at a perceived value zone. This activity helps form a stronger base of support, which could eventually rebuild conviction among retail holders.
| Metric | Value | Interpretation |
|---|---|---|
| Weekly Price Change | +2.13% | Positive momentum from key support |
| Critical Resistance | $2.15 | Ceiling from late-December 2025 rally |
| Primary Support | $1.80 | Post-election floor, heavily defended |
| Long/Short Ratio | 3.3 | Strong bullish sentiment among futures traders |
| Weekly ETF Inflows | $23M | Institutional capital flow remains positive |
The Path Forward: Key Levels to Watch
The immediate future for XRP hinges on its ability to conquer specific price thresholds. The $2.15 level represents the most significant near-term hurdle. This price point acted as a firm ceiling during the late-December 2025 rally, rejecting multiple attempts to move higher. A decisive weekly close above $2.15, accompanied by strong volume, would signal a potential trend reversal and could trigger a wave of short covering and renewed buying interest. Conversely, failure at this resistance for a third time would reinforce the bearish structure and increase the risk of a breakdown. In such a scenario, the focus would shift back to the $1.80 support zone. A sustained break below this level could initiate a new leg down, potentially testing lower supports and forcing capitulation from recently accumulated underwater holders.
- Bullish Scenario: A break above $2.15 with high volume invalidates the pattern of lower highs and targets the next resistance near $2.50.
- Bearish Scenario: Rejection at $2.15 followed by a break below $1.80 could see XRP retreat toward the $1.50–$1.60 range.
- Neutral/Rangebound Scenario: Price continues to oscillate between $1.80 and $2.15, allowing for further accumulation and base-building.
Expert Context: Market Psychology and Macro Risks
Financial analysts emphasize that cryptocurrency prices, especially for major altcoins like XRP, are dictated by a confluence of technicals, on-chain fundamentals, and macro sentiment. The current environment is a tug-of-war between positive on-chain accumulation and negative macro headlines. While rotation into altcoins and solid ETF inflows provide fuel for upside, the overarching macro FUD related to fiscal policy and interest rates acts as a persistent headwind. Furthermore, the outcome of Ripple’s ongoing engagement with global regulatory bodies continues to be a fundamental variable affecting long-term investor confidence. Until the price action demonstrates a clear change in structure by breaking key resistance, the overall bias, as defined by classical technical analysis, remains cautiously bearish.
Conclusion
The XRP price narrative in early 2026 is one of conflict between encouraging capital flows and persistent technical resistance. The altcoin benefits from a historically strong support floor near $1.80, positive ETF inflows, and strategic whale accumulation. However, it remains trapped by a weakening market structure defined by consecutive lower highs and the formidable $2.15 resistance ceiling. For the bearish bias to be invalidated, XRP must achieve a convincing breakout above this level. Until then, the market presents a high-conviction accumulation zone for long-term believers but a risky proposition for short-term traders. The coming weeks will be decisive in determining whether the current activity represents the formation of a durable base or merely a pause before further downside.
FAQs
Q1: Why is the $2.15 level so important for XRP?
The $2.15 price level is a major technical resistance level that capped XRP’s rally in late December 2025. It has rejected multiple breakout attempts, making it a key benchmark that traders watch to confirm a change in market structure from bearish to bullish.
Q2: What does ‘underwater holders’ mean in this context?
It refers to investors who purchased XRP at higher price points and are now holding the asset at a loss. A large concentration of underwater holders can create ‘sell-side pressure’ if the price rallies to their average buy-in level, as they may sell to break even.
Q3: How do ETF inflows affect the XRP price?
Weekly net inflows into XRP ETFs, like the reported $23 million, represent direct institutional buying pressure. This demand absorbs sell orders and provides underlying support for the price, indicating professional money managers see value at current levels.
Q4: What is the significance of the Long/Short ratio being at 3.3?
A Long/Short ratio of 3.3 means that for every trader holding a short (bearish) position in XRP futures, there are 3.3 traders holding a long (bullish) position. This shows a strong skew in market sentiment toward optimism, though extreme readings can sometimes signal a crowded trade.
Q5: Can macro FUD alone keep XRP below $2?
While macroeconomic uncertainty creates headwinds for all risk assets, including cryptocurrencies, price is ultimately determined by supply and demand. Persistent macro FUD can dampen overall market sentiment and delay rallies, but sustained buying pressure from accumulation (as seen in on-chain data) can eventually overcome it if strong enough.
This article was produced with AI assistance and reviewed by our editorial team for accuracy and quality.