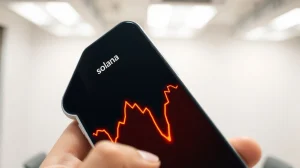
Solana Price Plunge: Analyzing the $83 Support as a Potential Strategic Entry

Solana’s SOL token has fallen sharply from its all-time high, now trading near $83. This represents a decline of roughly 77% from its peak near $250. The $80 level is currently acting as a critical technical support zone. Market participants are scrutinizing this price action to determine if it signals a major buying opportunity or a pause before further declines.
Technical Breakdown of Solana’s Current Position
According to chart data from March 2026, SOL’s price sits near a significant Fibonacci retracement level. The 0.618 Fibonacci level, often watched by technical traders, is providing support. A breach below $80 could see the token test lower zones. Analysts have identified a broader accumulation range between $75 and $45. This zone is seen by some as a potential area for longer-term investors to build positions.
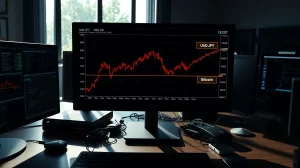
Also read: USD/JPY Surges Past 160 – Could This Trigger a Bitcoin Collapse?
Market data reveals intense trading activity. On the 4-hour chart, long position liquidations for SOL recently exceeded $1.04 million. This suggests a wave of forced selling from traders using tap into. Meanwhile, exchange data shows a notable skew in trader positioning. The long-short ratios on major platforms like Binance and OKX have remained above 3. A ratio above 1 indicates more traders hold long positions than short ones. A persistently high ratio can sometimes signal crowded trades, which may increase volatility.
Market Sentiment and On-Chain Context
The dramatic price drop from $250 must be viewed within the broader crypto market cycle. Solana experienced rapid growth in 2021, followed by a severe contraction. Network performance and developer activity often provide fundamental context for price moves. Data from Solana blockchain explorers shows the network continues to process millions of transactions daily. However, the token’s price remains disconnected from this utility metric, a common trait in bear markets.
Also read: Circle USDC Freeze Reversal: Critical KYT Compliance Decision Unlocks 500 Casino and Whale Wallets
Industry watchers note that high long-short ratios during a downtrend can be a contrarian indicator. It may reflect excessive optimism among retail traders despite falling prices. This dynamic often precedes sharp moves. The implication is that sentiment remains fragile. A break below the cited support could trigger another wave of liquidations.
Comparing Historical Crypto Market Cycles
Previous crypto bear markets provide a rough guide. Major assets like Bitcoin and Ethereum have historically seen drawdowns exceeding 80% from their peaks. Solana’s 77% decline is within this historical range. What this means for investors is that while prices appear low, they may not have bottomed. The posted $75-$45 accumulation zone aligns with the type of deep-value ranges seen in past cycles. Traders often use such zones to dollar-cost average, buying set amounts at regular intervals regardless of price.
Liquidation Dynamics and Exchange Flows
The $1.04 million in 4-hour long liquidations is a key data point. Liquidations occur when a leveraged position is automatically closed due to insufficient collateral. This selling is non-discretionary and can exacerbate price moves. High liquidation volumes near a support level like $80 indicate the level is being tested aggressively. If support holds, liquidations may subside. If it breaks, a cascade of further liquidations could follow.
Exchange flow data offers another angle. Periods of price decline often see tokens move from exchange wallets to private custody. This movement can signal a shift from selling intent to holding intent. Current on-chain metrics for Solana show mixed signals. Some large holders appear to be accumulating, while others distribute. This divergence is typical at potential inflection points.
Risk Factors and Macro Considerations
Evaluating Solana at $83 requires a risk assessment. The crypto market does not operate in a vacuum. Global interest rate policy and equity market performance influence capital flows. In early 2026, macroeconomic conditions remain a headwind for speculative assets. Regulatory developments also pose an ongoing risk. Any adverse policy news could impact Solana alongside the broader sector.
Key technical levels to watch:
- Immediate Support: $80
- Major Support Zone: $75 – $45
- Near Resistance: $100 (psychological level)
- Fibonacci Level: 0.618 retracement near current price
This suggests the market is at a decision point. The next sustained move above $100 or below $75 will likely dictate the medium-term trend.
Conclusion
Solana’s price action presents a classic high-risk, high-reward scenario. Trading near $83 and the 0.618 Fibonacci level, SOL is testing a generational support zone. Market data shows heavy utilize and mixed sentiment, with long liquidations adding selling pressure. The $75 to $45 range represents a potential accumulation area for patient capital. However, macroeconomic and regulatory risks persist. Investors should weigh technical signals against fundamental network health and broader market conditions. The Solana price story in March 2026 is one of a major asset searching for a floor after a historic run-up and subsequent fall.
FAQs
Q1: What does a 0.618 Fibonacci retracement level mean?
In technical analysis, Fibonacci retracement levels are horizontal lines that indicate where support or resistance might occur. The 0.618 level (or 61.8%) is derived from the Fibonacci sequence and is considered a key area where trends may pause or reverse.
Q2: What is a long-short ratio on an exchange?
The long-short ratio compares the number of traders holding long positions (betting the price will rise) to those holding short positions (betting the price will fall). A ratio above 3, as reported on Binance and OKX, means long positions significantly outnumber short ones.
Q3: What causes a long liquidation?
A long liquidation is the forced closure of a leveraged long position. It happens when the price falls enough that the trader’s collateral no longer covers the position, triggering an automatic sell order from the exchange.
Q4: Is Solana’s network still active despite the price drop?
Yes. On-chain data shows the Solana blockchain continues to process transactions and support decentralized applications. Price and network usage can be disconnected in the short term.
Q5: What is meant by an ‘accumulation zone’?
An accumulation zone is a price range where investors are believed to be consistently buying and building positions over time, often during a bear market or period of consolidation, in anticipation of a future price recovery.
This article was produced with AI assistance and reviewed by our editorial team for accuracy and quality.