Solana Price Prediction: Critical Warning Signals $67 Target After Failed $90 Breakout
Market analysts issued a critical warning about Solana’s price trajectory on March 15, 2025, as the cryptocurrency faces mounting pressure following repeated failures to breach the essential $90 resistance level. Technical indicators now suggest SOL could potentially test the $67 support zone, marking a significant 25% decline from current levels. This development comes amid broader cryptocurrency market volatility and shifting investor sentiment toward blockchain assets.
Solana Price Prediction: Technical Breakdown
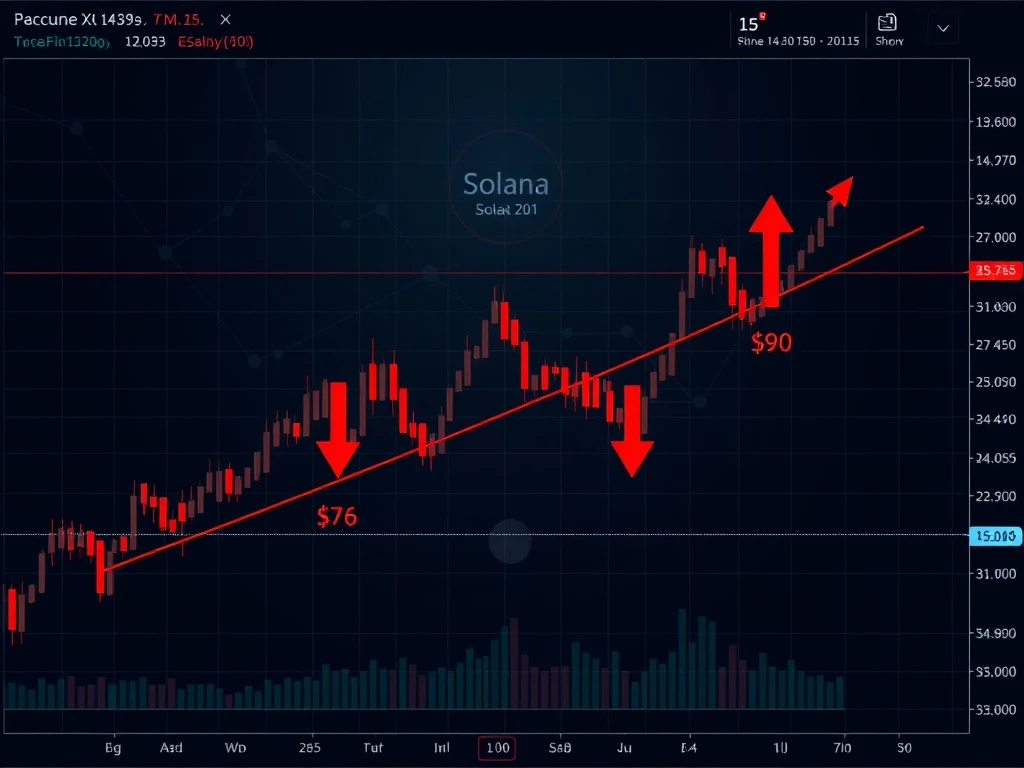
Technical analyst Crypto Bully identified concerning patterns in Solana’s recent price action. The cryptocurrency has attempted multiple breakouts above the $90 resistance zone throughout March 2025, but each attempt has met with substantial selling pressure. Consequently, this repeated rejection has weakened market structure and increased downside risks. The $76 support level, previously considered resilient, now shows signs of vulnerability according to trading volume and order book analysis.
Also read: Bitcoin Surges as Bulls Mount Fierce Defense of $65K, Eye $72K Breakout
Market data reveals several critical technical factors influencing this prediction. First, trading volume during recent decline phases has exceeded volume during upward movements, indicating stronger selling pressure. Second, the Relative Strength Index (RSI) has remained below the 50 midpoint for extended periods, suggesting bearish momentum dominance. Third, moving average convergence divergence (MACD) indicators show persistent negative divergence since late February 2025.
Key Technical Levels and Market Structure
Understanding Solana’s current technical position requires examining multiple timeframes and market structure elements. The daily chart shows a clear pattern of lower highs since the February peak, while the weekly chart reveals potential support clustering around the $67 level. This price point aligns with previous consolidation zones from November 2024 and represents a significant liquidity pool according to exchange data.
Also read: Bitcoin Mining Difficulty Plummets: Network Data Signals 14% Downward Adjustment
The following table summarizes critical technical levels and their significance:
| Price Level | Significance | Timeframe |
|---|---|---|
| $90 | Major resistance, multiple rejections | March 2025 |
| $76 | Current support, showing weakness | Immediate |
| $67 | Next major support, high liquidity | Potential target |
| $58 | Long-term support, 2024 low | Worst-case scenario |
Market Context and Broader Implications
Solana’s technical challenges occur within a complex cryptocurrency ecosystem experiencing multiple simultaneous pressures. Regulatory developments, macroeconomic factors, and blockchain-specific events all contribute to current market conditions. The Federal Reserve’s interest rate decisions, inflation data releases, and institutional adoption patterns create additional layers of complexity for cryptocurrency valuations.
Several blockchain industry factors specifically impact Solana’s position. First, network activity metrics show mixed signals with transaction volumes remaining healthy but new address growth slowing. Second, competing layer-1 blockchain platforms have announced significant technical upgrades scheduled for 2025. Third, decentralized finance (DeFi) total value locked (TVL) across Solana-based protocols has shown modest declines in recent weeks according to DeFiLlama data.
Expert Perspectives and Historical Precedents
Market analysts emphasize the importance of historical context when evaluating current price predictions. Solana experienced similar technical patterns in September 2024 when resistance at $85 led to a decline toward $65. That previous episode resulted in a 23% correction before establishing a new upward trend. Technical analysts note that such corrections often create healthier market conditions by clearing overleveraged positions and establishing stronger support foundations.
Several cryptocurrency research firms have published related analyses. Bloomberg Intelligence highlighted increasing correlation between Solana and broader technology stocks in Q1 2025. Meanwhile, CoinMetrics research indicates changing on-chain metrics including increased token movement to exchanges, typically a precursor to selling pressure. These data points provide additional context for understanding current market dynamics.
Liquidity Dynamics and Market Mechanics
Modern cryptocurrency markets operate through complex liquidity mechanisms that significantly influence price movements. The concept of “liquidity-driven selloffs” referenced in the original analysis refers to situations where price moves trigger cascading liquidations in derivative markets. Solana’s futures open interest has reached elevated levels in recent weeks, increasing vulnerability to such liquidation events according to Coinglass data.
Key liquidity factors currently affecting Solana include:
- Derivative market exposure: High apply positions increase volatility risks
- Exchange liquidity distribution: Order book depth varies significantly across platforms
- Institutional participation: Changing patterns among large investors
- Market maker activity: Algorithmic trading responses to volatility
These elements combine to create the conditions analysts describe as requiring either a “liquidation wick” or “strong impulse” for trend reversal. A liquidation wick refers to a sharp, brief price movement that triggers stop losses and liquidations before reversing direction. Meanwhile, a strong impulse indicates sustained buying pressure with increasing volume that can overcome technical resistance levels.
Comparative Analysis with Other Cryptocurrencies
Solana’s technical situation shares similarities and differences with other major cryptocurrencies. Ethereum has maintained stronger support levels despite similar market pressures, while Avalanche shows parallel resistance challenges at key psychological price points. Bitcoin’s dominance rate fluctuations also influence altcoin markets including Solana, as capital rotation between assets creates additional volatility factors.
Blockchain-specific developments provide further context. Solana’s network upgrade schedule includes significant improvements planned for Q2 2025, potentially affecting investor sentiment. Additionally, the broader non-fungible token (NFT) market recovery pace impacts Solana-based projects and associated token demand. These fundamental factors interact with technical patterns to create the current market environment.
Risk Management Considerations for Investors
Professional traders emphasize specific risk management strategies during periods of technical uncertainty. Position sizing adjustments, stop-loss placement methodologies, and portfolio rebalancing approaches all require careful consideration. Historical volatility data suggests Solana typically experiences 30-day volatility between 60-80% during corrective phases, significantly higher than traditional assets.
Several practical approaches help address current market conditions. First, diversification across cryptocurrency sectors reduces single-asset risk exposure. Second, dollar-cost averaging during decline phases can mitigate timing risks. Third, monitoring derivative market metrics provides early warning signals for potential liquidation events. These strategies align with institutional investment frameworks adapted for cryptocurrency markets.
Conclusion
Technical analysis suggests Solana faces significant challenges breaking above the $90 resistance level, with potential downside targets extending to $67 based on current market structure. This Solana price prediction emerges from multiple technical factors including weakening support, bearish momentum indicators, and liquidity dynamics. However, cryptocurrency markets remain highly dynamic, and fundamental blockchain developments continue evolving. Investors should monitor both technical indicators and fundamental network metrics while implementing appropriate risk management strategies. The coming weeks will determine whether Solana establishes stronger support or experiences the predicted decline toward lower price targets.
FAQs
Q1: What technical factors support the $67 price prediction for Solana?
The prediction relies on multiple technical factors including repeated rejections at $90 resistance, weakening support at $76, bearish momentum indicators like RSI and MACD, and liquidity analysis showing significant support clustering around $67 based on historical price action.
Q2: How does Solana’s current situation compare to previous market corrections?
Current patterns show similarities to September 2024 when resistance at $85 led to a 23% decline. Historical corrections often create healthier market conditions by clearing overleveraged positions, though each market environment has unique characteristics based on broader conditions.
Q3: What would invalidate the bearish Solana price prediction?
A sustained breakout above $90 with increasing volume would challenge the bearish outlook. Additionally, strengthening support at $76 or fundamental developments like significant network upgrades or institutional adoption could shift market sentiment and technical dynamics.
Q4: How do derivative markets affect Solana’s price movements?
High use in futures markets increases vulnerability to liquidation cascades during volatility. Current elevated open interest creates conditions where price movements can trigger automated liquidations, potentially accelerating declines or creating sharp reversal opportunities.
Q5: What time horizon applies to this technical analysis?
The analysis primarily focuses on short to medium-term timeframes, typically days to weeks. Technical patterns evolve continuously, requiring regular reassessment as new price action develops and market conditions change based on both technical and fundamental factors.
This article was produced with AI assistance and reviewed by our editorial team for accuracy and quality.