Render RENDER Price Analysis: Critical $2 Support Holds as Bulls Face Potential Shakeout
January 25, 2026 – Render (RENDER) maintains its position above the crucial $2.00 support level despite recent market volatility, leaving traders questioning whether cryptocurrency bulls face another significant shakeout before establishing a sustainable upward trend. The AI-focused digital asset demonstrated remarkable strength earlier this month with an 85% price surge, significantly outperforming sector competitors Chainlink (LINK) and Bittensor (TAO). However, recent data reveals concerning signals that warrant careful examination by market participants.
Render RENDER Technical Analysis: The $2.00 Battlefield
Render’s journey through January 2026 presents a compelling case study in cryptocurrency market dynamics. The token’s explosive 85% growth during the first week established it as a standout performer within the artificial intelligence cryptocurrency sector. This remarkable surge pushed RENDER past the psychologically significant $2.00 resistance level, creating optimism among investors and traders alike. Nevertheless, subsequent market behavior has introduced complexity to the bullish narrative.
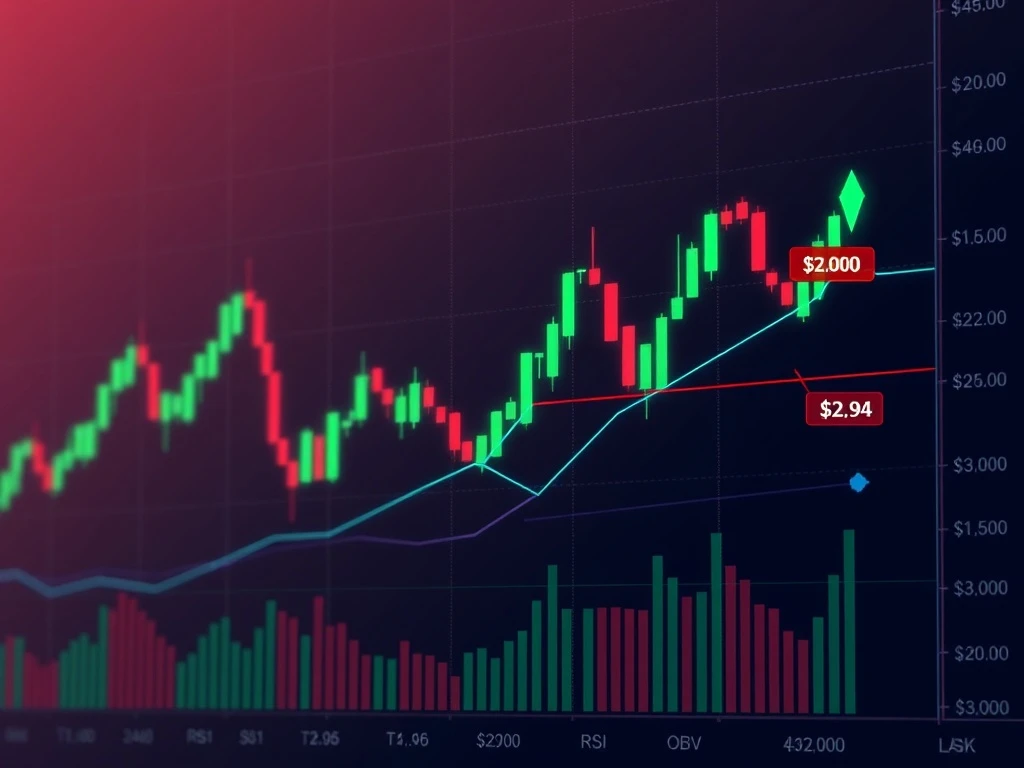
Recent trading data from Coinalyze indicates a substantial 30% decline in Open Interest following the initial rally. This reduction suggests decreased market participation and potentially waning conviction among leveraged traders. Meanwhile, the price has retraced to retest the former resistance-turned-support zone around $2.00, creating a critical technical juncture for the cryptocurrency.
On-Chain Metrics and Comparative Analysis
A comprehensive Crypto News Insights report provides crucial context by comparing Render’s on-chain metrics against another prominent AI token, Artificial Superintelligence Alliance (FET). The analysis reveals that Render’s metrics currently trail behind FET’s performance across several key indicators. This comparative disadvantage, combined with the unbroken longer-term downtrend on RENDER’s price chart, raises legitimate questions about the token’s immediate bullish potential.
Technical indicators present a mixed but nuanced picture. The On-Balance Volume (OBV) indicator reached new highs during RENDER’s rally to $2.71 two weeks ago, demonstrating significant buyer dominance during that period. Additionally, the daily Relative Strength Index (RSI) maintains its position above the neutral 50 level, suggesting that upward momentum hasn’t been completely exhausted despite recent price retracement.
Market Structure and Liquidation Dynamics
The cryptocurrency’s failure to breach the $2.94 swing high from November represents a critical technical development. This resistance level’s persistence maintains the longer-term downtrend structure, creating a substantial hurdle for bullish momentum. Market analysts emphasize that until RENDER decisively breaks above this threshold, the overarching bearish structure remains technically intact.
Liquidation maps from CoinGlass reveal potentially influential market mechanics. The concentration of cumulative short liquidation leverage near current price levels creates downward pressure that could temporarily drag prices lower. Conversely, significant long liquidation leverage accumulates above $2.15, potentially creating upward attraction once prices stabilize.
Key Price Levels and Trading Strategy Considerations
Technical analysis identifies several critical price zones that could determine RENDER’s near-term trajectory:
- Immediate Support: $2.00 psychological level
- Short-term Target: $1.86-$1.88 liquidity zone
- Higher Timeframe Supply: $1.68-$1.86 range from November
- Resistance: $2.15 and $2.94 swing high
Market structure analysis suggests that RENDER might experience a price dip below $2.00 in coming sessions. Such a movement would likely target the $1.86-$1.88 liquidity zone, which resides within the broader November supply area between $1.68 and $1.86. Many technical traders anticipate this region could serve as an accumulation zone before potential upward movement.
AI Cryptocurrency Sector Context and Performance
Render operates within the competitive artificial intelligence cryptocurrency sector, which has demonstrated both correlation and divergence patterns throughout 2025 and early 2026. The sector’s performance often reflects broader technological adoption trends, regulatory developments, and institutional investment flows into AI infrastructure projects.
Comparative analysis reveals that while Render significantly outperformed peers during early January, sector-wide metrics suggest varying fundamental strengths across different AI tokens. The Artificial Superintelligence Alliance (FET) demonstrates stronger on-chain metrics according to recent reports, while Chainlink (LINK) maintains different utility characteristics as a decentralized oracle network rather than a pure AI computation platform.
| Token | Price Increase | Sector Role | Key Metric Status |
|---|---|---|---|
| Render (RENDER) | 85% | Decentralized GPU Rendering | Mixed Technical Signals |
| Chainlink (LINK) | Moderate | Decentralized Oracles | Stable Network Growth |
| Bittensor (TAO) | Limited | Decentralized Machine Learning | Specialized Niche |
| FET | Significant | Artificial Superintelligence | Strong On-Chain Metrics |
Expert Perspectives on Market Conditions
Seasoned market analysts emphasize the importance of distinguishing between short-term volatility and longer-term structural trends. The cryptocurrency market’s inherent volatility often creates dramatic price movements that don’t necessarily reflect fundamental changes in project viability or adoption. Technical analysis provides tools for navigating these conditions but requires integration with broader market understanding.
Market participants should consider multiple timeframe analysis when evaluating tokens like Render. While daily charts show potential weakness, weekly and monthly perspectives might reveal different structural patterns. Additionally, the relationship between price action and on-chain metrics offers valuable insights into whether movements reflect speculative trading or genuine adoption growth.
Risk Management and Strategic Considerations
Successful cryptocurrency trading requires disciplined risk management, particularly during periods of potential market transition. The current technical setup for RENDER suggests several strategic approaches for different trader profiles:
- Conservative Traders: Await confirmation of support holding at $1.86-$1.88 or breakout above $2.15 with volume
- Moderate Risk Tolerance: Consider partial positions at current levels with stops below $1.86
- Technical Traders: Monitor OBV and RSI divergences for early momentum signals
- Long-term Investors: Evaluate fundamental developments beyond price action
The concentration of liquidation levels creates potential for increased volatility as price approaches these thresholds. Traders should account for this dynamic when establishing position sizes and risk parameters. Market structure suggests that a sweep of the $1.86-$1.88 region could create favorable risk-reward opportunities if accompanied by appropriate technical confirmations.
Conclusion
Render RENDER faces a critical technical juncture as it maintains support above the psychologically significant $2.00 level. The cryptocurrency’s impressive early January performance demonstrates its potential within the AI sector, while recent retracement highlights ongoing market uncertainties. Technical analysis suggests that bulls might face another shakeout targeting the $1.86-$1.88 liquidity zone before establishing sustainable upward momentum. Market participants should monitor key resistance at $2.15 and $2.94 alongside on-chain metrics and sector developments. The Render price analysis ultimately reveals a cryptocurrency at a crossroads, with technical indicators providing guidance but requiring confirmation through price action and volume patterns.
FAQs
Q1: What is the current technical status of Render (RENDER)?
Render maintains support above $2.00 despite retracing from recent highs. Technical indicators show mixed signals with OBV suggesting previous buyer dominance and RSI maintaining above neutral levels, but the longer-term downtrend remains unbroken below $2.94.
Q2: How does Render’s performance compare to other AI cryptocurrencies?
Render significantly outperformed peers like Chainlink and Bittensor in early January with 85% growth. However, comparative on-chain analysis shows FET demonstrates stronger metrics, highlighting varying fundamental strengths across the AI cryptocurrency sector.
Q3: What are the key price levels to watch for RENDER?
The immediate support is $2.00, with potential downside targets at $1.86-$1.88. Resistance levels include $2.15 and the critical $2.94 swing high from November. The $1.68-$1.86 zone represents higher timeframe supply from November.
Q4: What do liquidation maps indicate for RENDER’s price action?
Liquidation data shows cumulative short liquidation leverage near current prices could create downward pressure, while long liquidation leverage above $2.15 might attract prices upward after potential dips. These concentrations often create volatility near these levels.
Q5: What trading strategy might be appropriate given current conditions?
Many technical analysts suggest waiting for potential dips toward the $1.86-$1.88 region before considering entries, as this would provide better risk-reward parameters. Traders should monitor for confirmations of support holding or breakouts above $2.15 with volume.
This article was produced with AI assistance and reviewed by our editorial team for accuracy and quality.