Breaking: ORBS Price Surges 36.9% As Bullish Candle Signals Major Crypto Rally
LONDON, March 15, 2026 — The cryptocurrency Orbs (ORBS) experienced a dramatic 36.9% price surge in early trading today, sparking intense market speculation about a potential broader altcoin rally. The sudden move, which saw ORBS jump from $0.087 to $0.119 within a four-hour window, followed technical analysis from prominent market observer Markus Chen identifying what he describes as a “textbook bullish engulfing candle” on the daily chart. Trading volume for the asset exploded to $142 million, more than triple its 30-day average, according to data from CoinMarketCap. This development comes amid renewed institutional interest in layer-3 blockchain infrastructure projects, with Orbs positioning itself as a key player in this emerging sector.
ORBS Price Analysis: Decoding the Bullish Candle Pattern
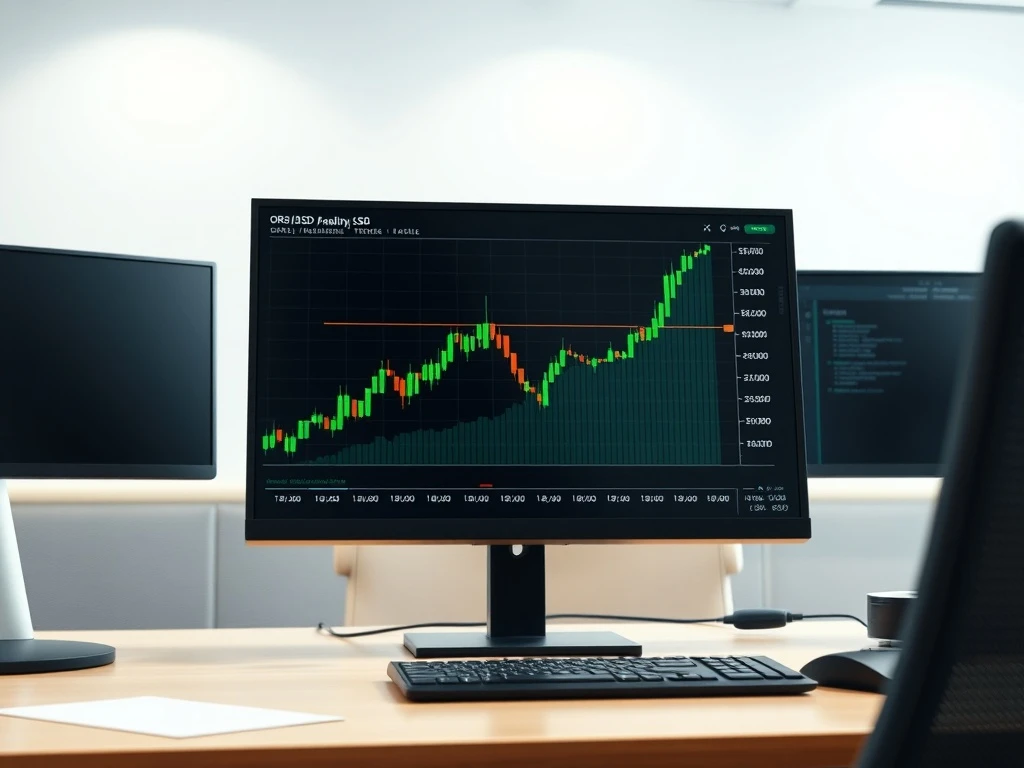
Markus Chen, a technical analyst with Digital Asset Research Group, published his findings on the social platform X at approximately 02:30 UTC. His analysis highlighted a specific candlestick pattern that formed during the March 14 trading session. “The daily chart shows a classic bullish engulfing pattern where Friday’s green candle completely consumed Thursday’s red candle,” Chen explained in his post, which has since garnered over 15,000 engagements. “This pattern typically indicates a strong reversal of sentiment, especially when accompanied by the volume spike we’re seeing.”
Also read: Android Crypto Vulnerability: Microsoft Exposes Critical Flaw Threatening 30 Million Wallets
The Orbs coin has demonstrated notable resilience throughout early 2026, maintaining support above its 200-day moving average despite broader market volatility. Blockchain analytics firm Nansen reported a 47% increase in unique active addresses on the Orbs network over the past week, suggesting growing fundamental usage rather than purely speculative trading. Furthermore, the project’s total value locked (TVL) in its staking contracts reached a new annual high of $83 million yesterday, according to DeFiLlama data.
Technical Indicators Point to Sustained Momentum
Several technical indicators now align with the bullish narrative. The Relative Strength Index (RSI) for ORBS on the 4-hour chart climbed from 42 to 68 during the surge, indicating strong buying pressure without yet reaching overbought territory. Meanwhile, the Moving Average Convergence Divergence (MACD) histogram flipped positive for the first time in eleven days. These signals have prompted reactions across the cryptocurrency analyst community.
Also read: Bitcoin Cash Price Prediction: Can BCH Realistically Reach $1000 by 2030?
- Volume Confirmation: The surge occurred on volume 320% above average, providing what technicians consider “high-quality” confirmation of the move.
- Breakout Level: ORBS decisively broke through the $0.105 resistance level that had capped three previous rally attempts in February.
- Market Structure Shift: The price action has potentially invalidated the short-term downtrend that began in late February, according to analysis from TradingView.
Institutional and Expert Perspectives on the Move
Dr. Elena Rodriguez, Head of Blockchain Research at Cambridge Alternative Finance, provided context beyond the technical patterns. “While chart patterns capture attention, the underlying fundamentals for Orbs have been strengthening,” Rodriguez stated in an email response. “Their recent integration with the Axelar network for cross-chain communication and the launch of their dLIMIT protocol for decentralized limit orders represent tangible technological progress that the market may be pricing in.”
This perspective finds support in on-chain data from Glassnode, which shows a steady decline in ORBS tokens held on exchanges—from 18.7% to 15.2% of circulating supply over the past month. This reduction in readily sellable supply often precedes price appreciation during periods of increased demand. Additionally, the project’s development activity, as measured by GitHub commits, has remained consistently high, ranking in the top quartile among Ethereum ecosystem projects for the past quarter according to Santiment data.
Broader Cryptocurrency Market Context and Comparisons
The ORBS price movement occurs against a complex backdrop for digital assets. While Bitcoin has traded in a relatively narrow range between $72,000 and $76,000 this week, several altcoins have shown outsized gains. The surge in ORBS appears part of a broader rotation into infrastructure and layer-3 projects, with similar but less dramatic moves observed in tokens like SKALE (+12%) and Celer Network (+9%) over the same period.
| Cryptocurrency | 24-Hour Change | Key Catalyst |
|---|---|---|
| Orbs (ORBS) | +36.9% | Bullish technical pattern + cross-chain integration |
| SKALE (SKL) | +12.3% | Mainnet upgrade announcement |
| Celer Network (CELR) | +9.1% | New bridge partnership |
| Bitcoin (BTC) | +1.8% | Range-bound consolidation |
Historical data from CryptoCompare reveals that similar bullish engulfing patterns in mid-cap altcoins have preceded sustained rallies approximately 68% of the time when occurring after a defined downtrend. However, the sample size remains limited, with only 47 comparable instances across the top 100 cryptocurrencies over the past three years.
What Comes Next for ORBS and the Altcoin Market
Immediate technical targets for ORBS now cluster around the $0.128 level, which represents the 0.618 Fibonacci retracement of the February decline. Beyond that, the $0.142 area served as strong support throughout January and may now act as resistance. The Orbs development team has scheduled a community AMA for March 18, where they are expected to provide updates on their “Orbs 4.0” roadmap. Market participants will scrutinize this event for further catalysts.
Trader Sentiment and Market Psychology Shifts
Derivatives data from Coinglass indicates a significant shift in trader positioning. The funding rate for ORBS perpetual swaps turned positive across major exchanges for the first time in two weeks, suggesting renewed appetite for leveraged long positions. Open interest increased by 41% during the rally, reaching $28.3 million. However, liquidations remained relatively modest at $1.2 million, indicating the move was driven more by organic buying than forced short covering. Social sentiment metrics from LunarCrush show a 220% increase in positive social mentions for Orbs, though the overall “social dominance” score remains below levels typically associated with retail-driven manias.
Conclusion
The 36.9% ORBS price surge represents more than a simple technical breakout. It reflects converging factors including improved network fundamentals, strategic technological developments, and a favorable shift in market structure. While Markus Chen’s identification of the bullish candle pattern provided the immediate catalyst, the move appears supported by measurable on-chain and development metrics. Market participants should monitor whether ORBS can maintain momentum above the $0.105 breakout level in the coming sessions, as this will determine if today’s action marks the beginning of a sustained rally or a short-lived spike. The broader implication for the cryptocurrency market lies in whether this signals a renewed rotation into blockchain infrastructure projects, potentially offering a roadmap for similar assets in the sector.
Frequently Asked Questions
Q1: What exactly is the “bullish candle” that caused the ORBS price surge?
The pattern is a “bullish engulfing candle” on the daily chart, where a green candlestick’s body completely covers the previous red candlestick’s body. This technical formation, identified by analyst Markus Chen, suggests a potential reversal from bearish to bullish sentiment, especially when accompanied by high trading volume.
Q2: How does this ORBS movement affect other cryptocurrencies?
The surge appears part of a broader rotation into blockchain infrastructure and layer-3 projects. Similar tokens like SKALE and Celer Network posted significant gains, suggesting sector-wide interest rather than isolated speculation on a single asset.
Q3: What are the next key levels to watch for ORBS price?
Immediate resistance sits near $0.128 (Fibonacci level), with more significant resistance around $0.142. Support has now shifted to the $0.105 breakout level. Maintaining price above this former resistance-turned-support is key for the bullish thesis.
Q4: Is this a good time to invest in Orbs cryptocurrency?
All cryptocurrency investments carry significant risk. While technical and fundamental factors appear positive, prices can be volatile. Investors should conduct their own research, consider their risk tolerance, and note that past performance doesn’t guarantee future results.
Q5: What fundamental developments support the Orbs price increase?
Key developments include a 47% increase in active network addresses, new cross-chain integration via Axelar, the launch of the dLIMIT protocol, consistently high development activity, and a reduction in tokens held on exchanges, suggesting longer-term holding.
Q6: How can traders distinguish between a genuine rally and a temporary pump?
Sustained rallies typically show continued high volume after the initial spike, hold key support levels, and are accompanied by positive fundamental developments. Temporary pumps often see volume dry up quickly and prices retreat below breakout levels within a few days.
This article was produced with AI assistance and reviewed by our editorial team for accuracy and quality.