LayerZero Defies Gravity: ZRO’s 11% Surge Signals Powerful Recovery Rally Amid $98M Institutional Moves
In a remarkable display of market resilience, LayerZero’s ZRO token surged 11% on January 22, 2026, defying expectations following a massive $98 million institutional transfer that typically triggers volatility. This unexpected price action reveals deeper structural strength in the cryptocurrency’s recovery narrative, challenging conventional market wisdom about supply shocks and institutional movements.
LayerZero’s Defiant Rally Against Institutional Headwinds
The cryptocurrency market witnessed an unusual phenomenon as ZRO absorbed a substantial supply shock without hesitation. Despite 57.3 million ZRO tokens moving into BitGo-managed institutional custody—a transaction representing approximately $98 million at current valuations—buyers responded immediately with aggressive accumulation. This immediate response pattern contradicts typical market behavior where large custody transfers often introduce uncertainty and temporary price suppression.
Market analysts observed that exchange-side liquidity remained constrained throughout the session, preventing sellers from forcing meaningful retracements. The price maintained elevated positions near daily highs, demonstrating consistent follow-through buying pressure. This behavior suggests sophisticated market participants interpreted the institutional transfer as strategic positioning rather than preparation for distribution, creating a fundamentally different market psychology than typically accompanies large movements.
Technical Structure Reinforces Recovery Narrative
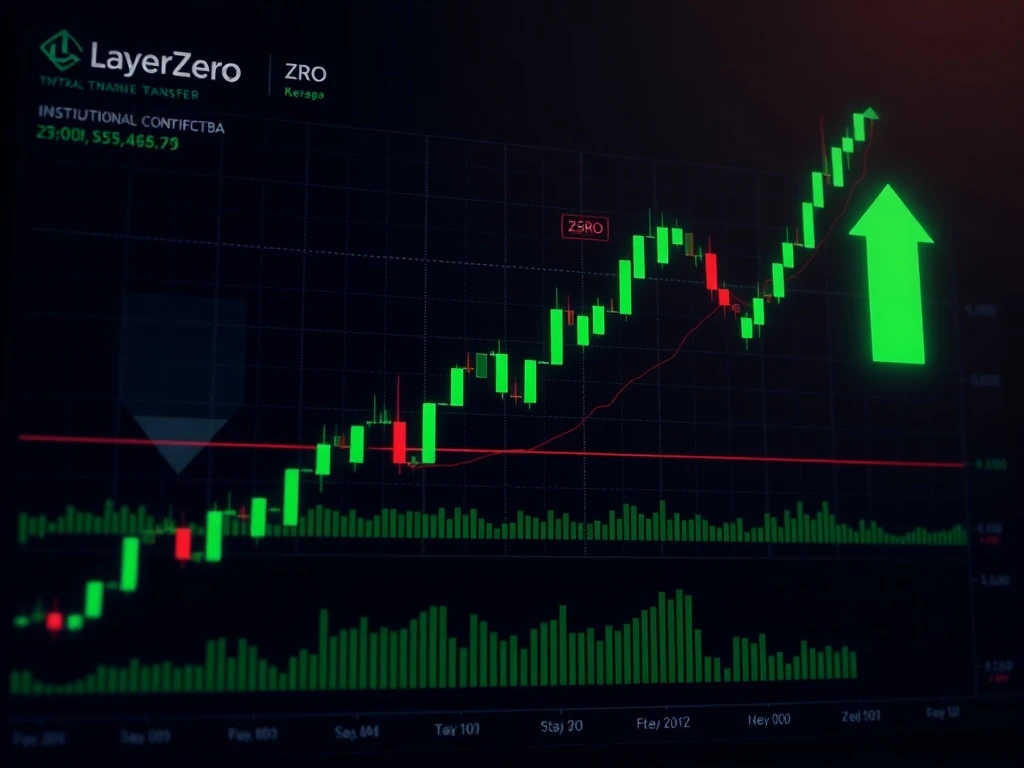
ZRO’s daily chart reveals a well-constructed technical foundation supporting the current advance. The cryptocurrency successfully defended December lows near $1.20, establishing a higher low that marked the definitive end of the prior decline phase. This price action created a classic double-bottom pattern—a technical formation widely recognized among traders as signaling potential trend reversals when confirmed with volume and follow-through.
Following the initial rebound, LayerZero reclaimed the critical support zone between $1.75 and $1.80, maintaining consistent acceptance above this level. This reclaim shifted market control from sellers to buyers, establishing a new foundation for upward movement. Additionally, ZRO moved decisively above the 50-day Exponential Moving Average (EMA), signaling improving intermediate-term trend alignment. The 50-day EMA serves as a crucial technical indicator watched by institutional and retail traders alike for determining market momentum direction.
Derivatives Data Confirms Constructive Market Participation
Open Interest—a key metric measuring total outstanding derivative contracts—rose more than 25% to approximately $52 million as ZRO continued its ascent. This alignment proves particularly significant because Open Interest expanded alongside price appreciation rather than diverging from it. When Open Interest increases with rising prices, it indicates traders are opening new positions rather than closing existing exposure, suggesting genuine conviction in the move’s sustainability.
This derivatives behavior contrasts sharply with short-covering rallies, where Open Interest typically declines as underwater positions unwind. The current pattern demonstrates leverage participation actively reinforcing spot market demand. However, analysts caution that rising Open Interest increases sensitivity to volatility shifts, meaning any price stall could trigger accelerated leverage unwinding. The market maintained remarkable stability despite increasing leverage, suggesting underlying confidence rather than speculative fragility.
Liquidation Dynamics Reveal Market Positioning
Liquidation data from January 21 provides crucial insight into market positioning during ZRO’s advance. Short liquidations dominated the session, reaching approximately $236,000 compared to just $32,000 in long liquidations. This substantial imbalance indicates traders positioned against the upward move faced sustained pressure throughout the rally. Major exchanges displayed consistent patterns:
- Binance: $74,800 in short liquidations versus $22,000 in longs
- Bybit: $46,400 in short liquidations
- OKX: $106,000 in short liquidations against $7,700 in longs
Importantly, these liquidations occurred in measured waves rather than a single concentrated spike. This pacing allowed price appreciation to develop organically without exhausting momentum prematurely. As short positions exited systematically, selling pressure diminished incrementally, enabling buyers to maintain control throughout the session while keeping market structure intact.
Liquidity Analysis Reveals Upward Bias Potential
The Binance ZRO/USDT liquidation heatmap reveals dense liquidity clusters concentrated between $2.00 and $2.05—levels that typically attract price movement as volatility builds. These zones represent areas where significant trading interest converges, often serving as magnets for price action. Current analysis suggests downside liquidity appears comparatively thinner, creating an asymmetrical setup that favors upward interaction in the near term.
Market technicians emphasize that liquidity clusters invite engagement rather than guarantee continuation. Price behavior near the $2.04-$2.05 resistance zone will define the next phase of ZRO’s movement. A controlled push through this level could trigger additional short liquidations and potentially accelerate upward momentum. Conversely, rejection at resistance would likely lead to consolidation above reclaimed support rather than immediate trend reversal, given the current structural improvements.
Historical Context and Market Evolution
LayerZero’s current performance reflects broader evolution in cryptocurrency market dynamics since 2023. Institutional participation has matured significantly, with custody solutions like BitGo’s offering sophisticated infrastructure for large-scale asset management. This maturation enables more nuanced market behavior where institutional movements don’t automatically trigger retail panic. The cryptocurrency ecosystem has developed deeper liquidity pools and more sophisticated risk management frameworks that absorb shocks more efficiently than in previous market cycles.
Furthermore, the 2024-2025 regulatory clarity in major jurisdictions has provided institutional investors with clearer operational frameworks. This regulatory evolution has reduced uncertainty premiums that previously amplified volatility around large transfers. The current market response to ZRO’s institutional movement demonstrates how cryptocurrency markets are integrating traditional financial market characteristics while maintaining their distinctive volatility profiles.
Comparative Analysis with Previous Market Cycles
Examining ZRO’s current behavior against historical cryptocurrency patterns reveals meaningful evolution. During the 2021-2022 cycle, similar-sized institutional transfers frequently triggered disproportionate volatility as markets interpreted them through a scarcity-of-information lens. The current response suggests improved market efficiency and information dissemination mechanisms. Several factors contribute to this evolution:
| Factor | 2021-2022 Cycle | 2025-2026 Cycle |
|---|---|---|
| Institutional Transparency | Limited reporting | Enhanced disclosure |
| Market Depth | Concentrated liquidity | Distributed liquidity |
| Analytical Tools | Basic on-chain metrics | Advanced custody tracking |
| Investor Sophistication | Retail-dominated reactions | Institutional-grade analysis |
This comparative framework helps explain why ZRO’s market absorbed the transfer with minimal disruption. The cryptocurrency ecosystem has developed more robust mechanisms for processing large movements without triggering cascading volatility. This maturation represents significant progress toward market stability and institutional integration.
Expert Perspectives on Market Structure Development
Financial analysts specializing in cryptocurrency market structure note that ZRO’s response pattern reflects deeper changes in how digital asset markets process information. “The immediate buyer response to substantial institutional movement demonstrates sophisticated market interpretation,” explains Dr. Anya Petrova, Director of Digital Asset Research at Cambridge Blockchain Analytics. “Market participants are distinguishing between strategic positioning and distribution preparation—a level of nuance that was largely absent in previous cycles.”
This analytical sophistication extends beyond professional traders to include retail participants with access to advanced on-chain analytics tools. The democratization of institutional-grade data has leveled the informational playing field, enabling more measured responses to market-moving events. This evolution contributes to reduced panic reactions and more efficient price discovery mechanisms across cryptocurrency markets.
Technical Pathway and Resistance Analysis
ZRO’s chart structure suggests a clear technical pathway for continued advancement, provided key support levels hold. The reclaimed zone between $1.75 and $1.80 now serves as critical support, with sustained acceptance above this range containing downside risk. Current momentum indicates potential for testing the $2.04 resistance level that previously capped advances.
A decisive break above $2.04 would open the technical chart toward the $2.60 region—a level representing approximately 30% upside from current positions. This movement would likely involve several phases, including initial breakout, consolidation, and potential acceleration as momentum builds. Market technicians emphasize the importance of volume confirmation during any breakout attempt, as low-volume advances often prove unsustainable.
Conversely, failure to maintain the $1.75 support would suggest the current recovery requires additional structural development. Such a scenario would likely involve retesting the double-bottom formation near $1.20 before establishing a new foundation for advancement. The probability-weighted analysis currently favors the continuation scenario given the strength of recent price action and derivatives alignment.
Risk Factors and Market Sensitivity Points
Despite the constructive technical setup, several risk factors warrant monitoring. The increased Open Interest creates sensitivity to volatility spikes, meaning any unexpected market developments could trigger disproportionate reactions. Additionally, broader cryptocurrency market conditions remain influential, with Bitcoin and Ethereum trends often establishing directional bias for altcoins like ZRO.
Regulatory developments continue to represent potential catalysts, particularly given ongoing global efforts to establish comprehensive digital asset frameworks. While 2025 brought significant clarity, implementation phases often introduce temporary uncertainty. Market participants should monitor these developments alongside technical factors when assessing ZRO’s trajectory.
Conclusion
LayerZero’s ZRO token demonstrates remarkable resilience with its 11% advance despite substantial institutional transfers, signaling sophisticated market absorption capabilities and improving technical structure. The cryptocurrency successfully defended critical support, pressured short positioning, and attracted aligned derivatives participation—all constructive developments for sustained recovery. Current analysis suggests the path toward $2.60 remains technically viable if buyers maintain the $1.75-$1.80 support zone and achieve acceptance above $2.04 resistance. The market’s mature response to institutional movements reflects cryptocurrency market evolution toward greater efficiency and analytical sophistication, potentially establishing new patterns for how digital assets process large-scale transactions in increasingly institutionalized environments.
FAQs
Q1: Why did ZRO price increase despite a large institutional transfer?
The price increased because market participants interpreted the transfer as strategic institutional positioning rather than preparation for selling. Buyers absorbed the additional supply immediately, demonstrating strong demand and confidence in ZRO’s fundamentals.
Q2: What technical pattern supports ZRO’s recovery?
ZRO formed a double-bottom pattern by defending December lows near $1.20 and establishing a higher low. This pattern, combined with reclaiming the $1.75-$1.80 support zone and moving above the 50-day EMA, created a constructive technical foundation.
Q3: How does derivatives data support the bullish case?
Open Interest increased 25% alongside price appreciation, indicating traders are opening new positions rather than closing existing ones. This alignment suggests genuine conviction rather than short-covering, with short liquidations significantly exceeding long liquidations during the advance.
Q4: What are the key resistance levels for ZRO?
The immediate resistance sits near $2.04, where previous selling pressure emerged. A sustained break above this level could open the path toward $2.60. The $2.00-$2.05 range contains dense liquidity clusters that will likely attract price interaction.
Q5: How has cryptocurrency market structure evolved to handle large transfers?
Markets have developed deeper liquidity, better analytical tools, and more sophisticated interpretation of institutional movements. Improved custody transparency and regulatory clarity have reduced uncertainty premiums, enabling more measured responses to large transactions compared to previous cycles.
This article was produced with AI assistance and reviewed by our editorial team for accuracy and quality.


