Hyperliquid’s 5% Surge: Why Skeptical Traders Doubt This Critical Reversal
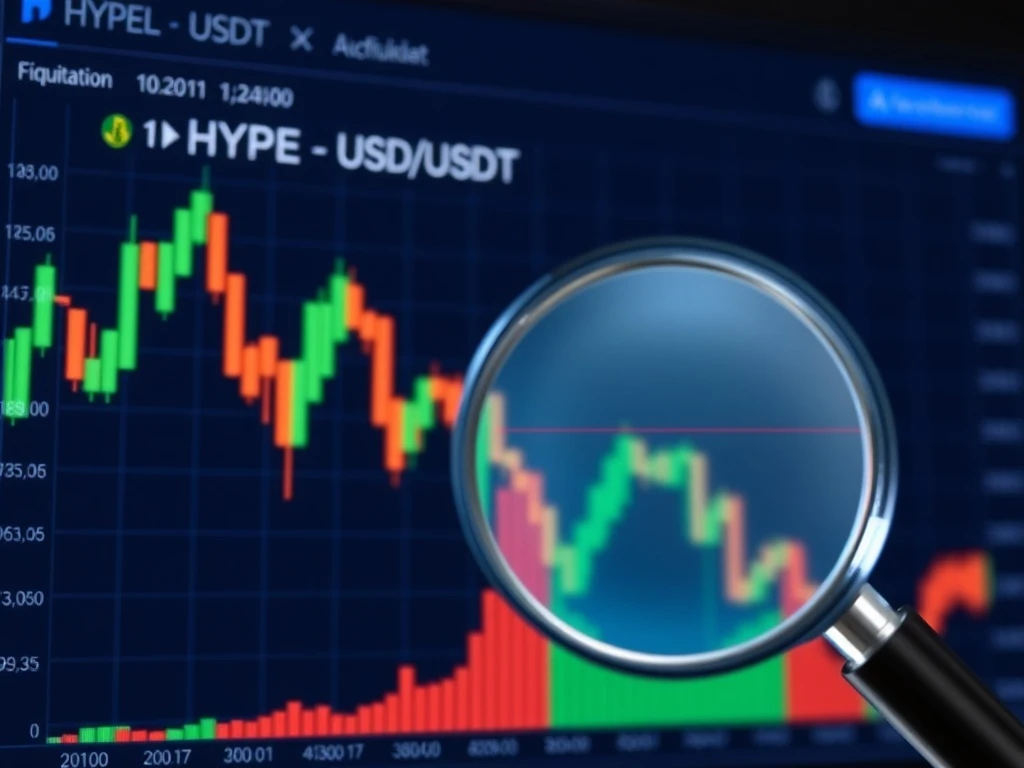
On January 24, 2026, the cryptocurrency Hyperliquid (HYPE) defied a stagnant broader market, posting a notable 5.15% gain within 24 hours. This surge, accompanied by a 53.6% spike in daily trading volume, captured immediate attention. However, a deeper examination of market structure and on-chain data reveals a landscape where seasoned traders are approaching this move with significant caution, questioning its sustainability as a genuine trend reversal.
Hyperliquid’s Rally Against a Stagnant Market Backdrop
The context of HYPE’s performance is crucial for understanding trader skepticism. During the same period, Bitcoin (BTC) was consolidating just below the formidable $90,000 psychological resistance level. Consequently, the broader altcoin market, excluding Ethereum, exhibited sideways to slightly negative momentum. This divergence gave HYPE’s gains an appearance of relative strength. Market analysts often scrutinize such divergent moves, as they can signal either emerging leadership or a deceptive bear market rally. The rally originated from a weekly low of $20.48, pushing the asset toward key Fibonacci retracement levels derived from its recent descent from $26.13.
Technical Analysis Reveals a Persistent Bearish Structure
A multi-timeframe technical assessment forms the core of the prevailing doubt. On higher timeframes, the trend structure remains decisively bearish.
- 3-Day Chart: Shows a sustained downward trend since October 2025.
- 4-Hour Chart: The plunge from $26.13 established a clear lower high and lower low pattern, a classic bearish swing structure.
- Key Resistance: Analysts identify the $26.13 level as a critical threshold. A sustained break above this point is necessary to invalidate the current bearish swing structure.
While shorter-term momentum indicators like the Awesome Oscillator show a positive shift, they are viewed within the context of this larger bearish framework. The Directional Movement Index (DMI) suggests the intensity of last week’s downtrend is easing, but it has not confirmed a new bullish trend. Therefore, the current price action is primarily classified as a counter-trend bounce within a larger decline.
Expert Insight: The Fibonacci Retracement Trap
Financial technicians emphasize the significance of Fibonacci levels during market corrections. The current bounce is testing the 50% retracement level near $23.31. Historically, these levels often act as reversal zones in bearish trends. “A bounce to the 50% or 61.8% Fibonacci level is a common feature in a healthy downtrend,” explains a veteran chart analyst. “It allows the market to rebalance before potentially resuming the primary direction. Traders are watching to see if HYPE faces rejection here, which would reinforce the bearish case.” This perspective underscores why the rally is not being interpreted as a reversal but rather a predictable technical reaction.
Liquidation Heatmaps Provide a Data-Driven Narrative
Beyond traditional charting, derivatives data offers a compelling reason for trader hesitancy. Analysis of the liquidation heatmap, which visualizes where leveraged positions are likely to be forced closed, reveals clear “liquidity magnets.”
| Price Zone | Liquidation Cluster Type | Market Implication |
|---|---|---|
| $24.5 | Dense Short Liquidations | Price may be drawn upward to trigger these stops. |
| $26.3 – $26.6 | Major Short Liquidation Zone | A stronger magnet that could fuel a sharper rally if reached. |
| $22.1 | Potential Long Liquidations | A downside target if the bounce fails. |
This data suggests the current move could be partially driven by the market’s mechanical need to liquidate over-leveraged short positions clustered around $24.5. Savvy traders view rallies into these zones not as breakout opportunities, but as potential areas to watch for exhaustion and a resumption of the downtrend.
The Broader Cryptocurrency Environment and Volatility Cycles
The article’s original reference to Monday volatility patterns adds a layer of real-world market behavior. The cryptocurrency market has historically exhibited specific volatility patterns around weekly opens and key trading sessions. The mention of this cycle suggests traders are factoring in timing, not just price levels. With Bitcoin’s price action dictating overall market sentiment, and with major hedge funds reportedly reducing exposure according to other market reports, the environment favors caution. Altcoin rallies during periods of Bitcoin consolidation are frequent but often short-lived unless they demonstrate independent, fundamental strength—which has not yet been established for HYPE in this instance.
Conclusion
The 5% surge in Hyperliquid (HYPE) presents a classic market dilemma: distinguishing a dead-cat bounce from a genuine trend reversal. The preponderance of evidence—from the higher-timeframe bearish structure and Fibonacci resistance levels to the derivative market’s liquidation landscape—currently supports the former. Traders are not dismissing the move but are treating it with skepticism, awaiting a confirmed break above $26.13 or a clear failure at key retracement levels before trusting the reversal. This analytical, evidence-based approach highlights the sophisticated tools and multi-faceted reasoning modern cryptocurrency traders employ to navigate volatile markets.
FAQs
Q1: What caused Hyperliquid (HYPE) to jump 5%?
The immediate catalyst appears to be a combination of oversold conditions, a market-wide search for altcoin opportunities during Bitcoin’s consolidation, and the triggering of clustered short liquidations around the $24.5 price level.
Q2: Why don’t traders trust this HYPE price rally?
Primary distrust stems from the unchanged higher-timeframe bearish trend structure. The rally is viewed as a counter-trend bounce within a larger decline until key resistance levels, notably $26.13, are decisively broken.
Q3: What is a liquidation heatmap and how is it used?
A liquidation heatmap is a data visualization tool that shows price levels where a high volume of leveraged long or short positions are set to be automatically closed. Traders use it to identify potential support/resistance zones and areas where volatile price “sweeps” might occur.
Q4: What price level would confirm a true bullish reversal for HYPE?
Most technical analysts would require a sustained break and close above the recent swing high of $26.13 to begin considering the bearish swing structure invalidated and a potential reversal in play.
Q5: How does Bitcoin’s price action affect Hyperliquid?
As a major altcoin, HYPE is significantly correlated with Bitcoin’s overall market sentiment. Bitcoin’s stagnation below $90k creates a risk-off environment where altcoin rallies are often viewed as temporary unless they show exceptional independent strength and volume.
This article was produced with AI assistance and reviewed by our editorial team for accuracy and quality.


