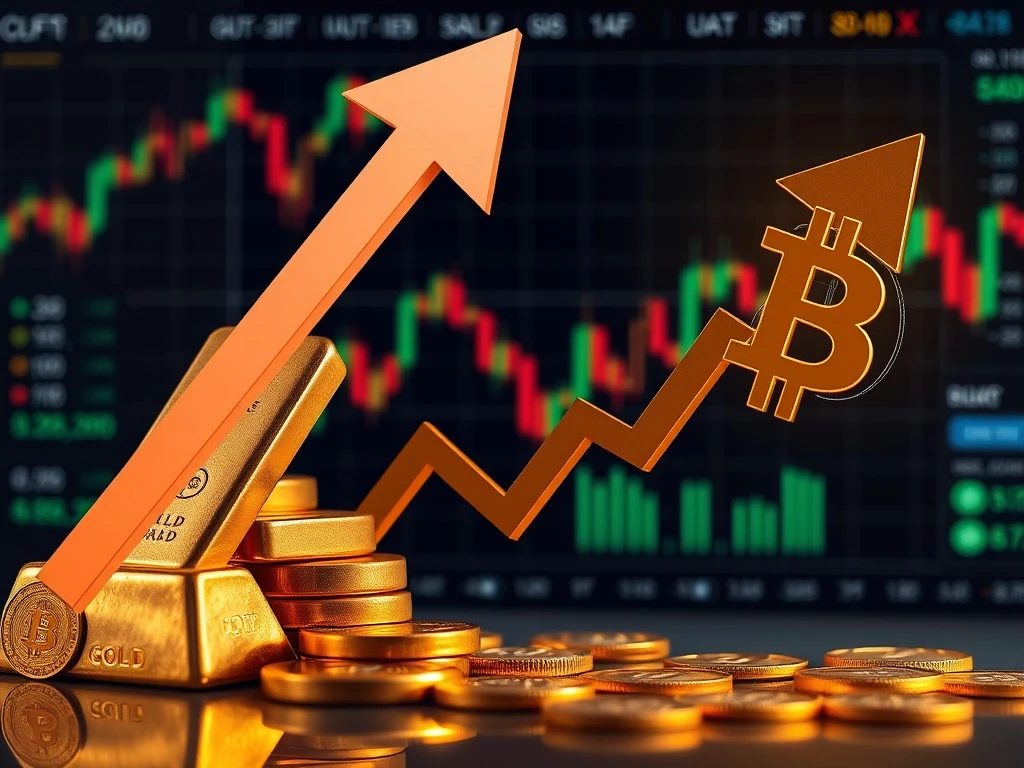
Gold Rally’s Historic Climax Signals Imminent Market Rotation to Stocks and Crypto
Global financial markets witnessed a significant milestone last month as gold prices surged to $5,600 per ounce, marking a staggering 427% increase since 2016 and signaling what historical analysis suggests could be the final phase of a decade-long precious metals bull run that may trigger substantial capital rotation into equities and digital assets.
Gold Rally Approaches Historical End Zone
Market analysts globally are closely monitoring gold’s unprecedented price trajectory. The precious metal’s recent achievement of $5,600 represents more than just a numerical milestone. Historical data from multiple market cycles indicates this price level consistently correlates with major trend reversals. According to comprehensive research by financial analytics firm Bull Theory, gold has now entered the precise valuation territory where every significant bull run since 1970 has concluded.
Financial historians note similar patterns occurred in 1980, 2011, and now potentially in 2025. Each previous cycle featured specific characteristics including extreme retail investor participation, central bank policy shifts, and emerging alternative investment opportunities. The current environment displays all these markers simultaneously, suggesting we may be witnessing a classic market rotation scenario.
Market Rotation Patterns and Historical Precedents
Historical market rotations follow identifiable patterns that experienced investors recognize. Following gold’s 1979-1980 surge, capital flowed aggressively into equities throughout the 1980s. Similarly, after gold’s 2011 peak, technology stocks began their decade-long dominance. The current situation presents unique characteristics because digital assets now represent a viable third option alongside traditional stocks and bonds.
Several key indicators suggest rotation may be imminent:
- Valuation metrics: Gold’s price-to-earnings ratio relative to historical averages
- Sentiment extremes: Retail investment flows into gold ETFs at record levels
- Technical signals: Multiple timeframe chart patterns showing exhaustion
- Macroeconomic shifts: Changing interest rate environments and inflation expectations
Expert Analysis of Current Market Conditions
Financial institutions including Goldman Sachs and JPMorgan Chase have published research noting the unusual concentration of assets in precious metals. Their analysts point to several factors that could accelerate rotation. First, institutional investors typically rebalance portfolios when asset classes reach extreme valuations. Second, younger investors demonstrate stronger preference for digital assets over traditional stores of value. Third, technological advancements in cryptocurrency infrastructure have created more accessible entry points for traditional investors.
The Federal Reserve’s monetary policy decisions significantly influence these dynamics. Historical data shows that tightening cycles often precede major asset rotations. Current projections suggest interest rate adjustments could begin within the next fiscal quarter, potentially catalyzing the movement analysts anticipate.
Cryptocurrency and Equity Market Preparedness
Digital asset markets have undergone substantial maturation since gold’s last major cycle peak in 2011. Bitcoin’s market capitalization now exceeds $1.3 trillion, while Ethereum’s ecosystem supports sophisticated financial applications previously unavailable. This infrastructure development creates natural receptacles for rotating capital seeking growth opportunities beyond precious metals.
Equity markets simultaneously present compelling alternatives. Technology sector innovation continues accelerating, particularly in artificial intelligence and renewable energy. These sectors offer growth potential that contrasts with gold’s defensive characteristics. Historical analysis reveals that post-gold-rotation periods typically favor growth-oriented assets over preservation-focused investments.
| Gold Peak Year | Subsequent Leading Asset | Rotation Timeframe | Average Returns (5 Years) |
|---|---|---|---|
| 1980 | U.S. Equities | 12-18 months | +187% |
| 2011 | Technology Stocks | 6-24 months | +312% |
| 2025 (Projected) | Crypto & Tech | TBD | TBD |
Global Economic Context and Implications
International developments significantly influence these market dynamics. Central banks worldwide have been net buyers of gold throughout this cycle, particularly institutions in China, Russia, and India. Their purchasing patterns may shift as prices reach historical resistance levels. Simultaneously, geopolitical tensions that traditionally support gold prices show signs of potential resolution in several regions.
Currency markets interact closely with precious metal valuations. The U.S. dollar’s relative strength against global currencies affects gold’s appeal as an alternative store of value. Recent dollar stabilization removes one supportive pillar from gold’s bull case, potentially accelerating rotation timing.
Investment Strategy Considerations
Portfolio managers emphasize several strategic approaches during potential rotation periods. First, gradual rebalancing typically proves more effective than abrupt position changes. Second, maintaining some precious metal exposure provides diversification benefits even during rotation phases. Third, fundamental analysis of receiving asset classes remains crucial rather than simply following momentum.
Risk management protocols become particularly important during transitional market periods. Historical volatility increases during rotations as capital seeks new equilibrium allocations. Experienced investors recommend position sizing strategies that account for this elevated uncertainty while maintaining exposure to emerging opportunities.
Conclusion
Gold’s remarkable decade-long rally now approaches territory that historically signals major market rotations. The precious metal’s 427% surge since 2016 represents one of the most significant bull runs in modern financial history. Current analysis suggests this gold rally may be entering its final phase, potentially triggering substantial capital movements into equities and cryptocurrency markets. Investors should monitor these developments closely while maintaining disciplined portfolio construction principles appropriate for transitional market environments.
FAQs
Q1: What specific price level indicates gold’s bull run might be ending?
Historical analysis identifies the $5,500-$5,800 range as critical resistance territory where previous major gold rallies concluded, making the recent $5,600 level particularly significant for market technicians.
Q2: How quickly do market rotations typically occur after gold peaks?
Historical precedents show rotations generally unfold over 6-24 months rather than instantaneously, allowing investors time to adjust strategies while monitoring confirmation signals.
Q3: Which asset classes historically benefit most from gold rotation periods?
Growth-oriented sectors typically outperform, particularly technology stocks during innovation cycles and, more recently, established cryptocurrency projects with substantial ecosystems and adoption.
Q4: Do all investors reduce gold exposure during rotation periods?
Institutional investors typically rebalance allocations while maintaining strategic positions, whereas retail investors historically demonstrate more extreme position changes based on momentum signals.
Q5: What indicators should investors monitor to confirm rotation is occurring?
Key signals include sustained capital outflows from gold ETFs, increasing volume in equity and crypto markets without corresponding gold volume, and breaking of critical technical support levels in gold charts.
