Ethereum ETF Inflows Surge to $117 Million – Critical Analysis Reveals Whether ETH Can Reclaim $3,000
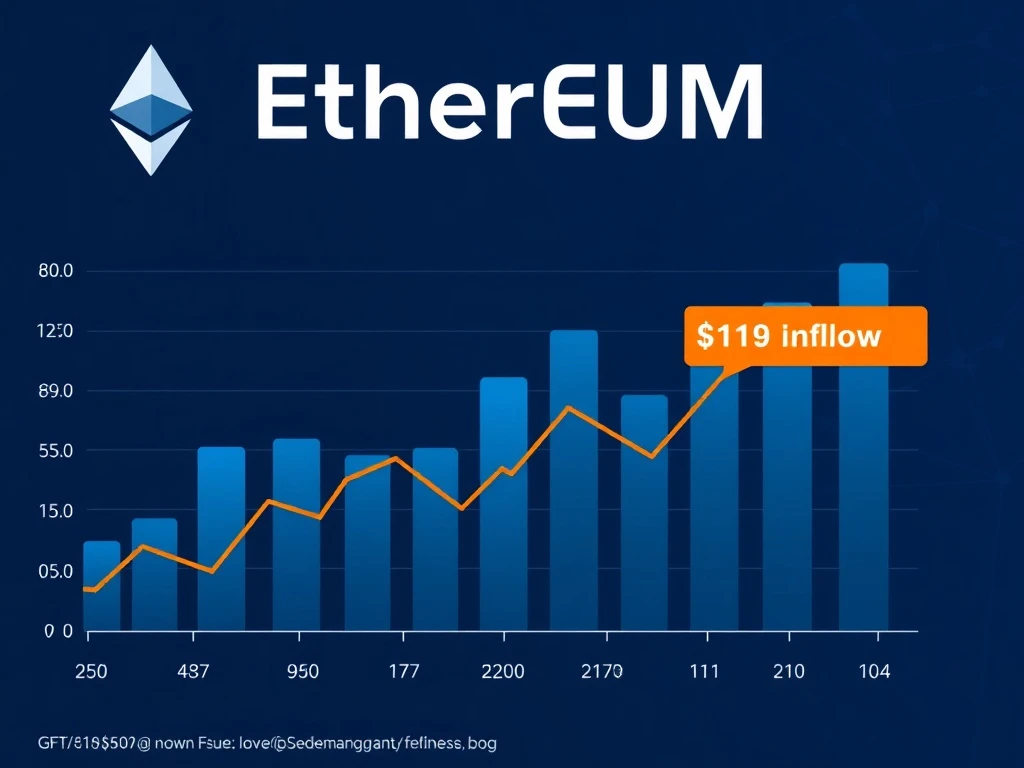
Ethereum’s institutional environment experienced a significant shift on January 26, 2026, as U.S. spot Ethereum ETFs recorded $117 million in net inflows, marking a potential turning point for the world’s second-largest cryptocurrency. This development occurred alongside Ethereum network fees reaching their lowest levels since May 2017, creating a complex market environment where improved fundamentals contrast with uncertain price momentum. The critical question now centers on whether these developments provide sufficient foundation for Ethereum to reclaim the psychologically important $3,000 threshold.
Ethereum ETF Inflows Signal Institutional Re-engagement
The $117 million net inflow into U.S. spot Ethereum ETFs represents the first substantial positive movement after multiple sessions of sustained outflows. According to verified market data, Fidelity dominated this session with $137 million in inflows, effectively snapping a four-day outflow streak that had concerned market observers. This reversal suggests renewed institutional interest, though the picture remains nuanced.
Also read: Crypto Listing Scams: Binance CEO Changpeng Zhao Issues Critical Warning to Investors
Interestingly, BlackRock registered net outflows on the same day, highlighting selective institutional positioning rather than broad-based accumulation. This divergence between major ETF providers indicates sophisticated allocation strategies among institutional players. Market analysts interpret this pattern as institutions potentially rebalancing portfolios or executing tactical reallocations rather than initiating uniform bullish positions across all providers.
The timing of these inflows coincides with broader market developments. Specifically, the cryptocurrency sector has experienced increased volatility surrounding regulatory announcements and macroeconomic indicators. Consequently, the ETF flow reversal provides vital insight into how sophisticated investors are working through current market conditions.
Network Fundamentals Strengthen as Fees Reach Historic Lows
Glassnode data reveals that Ethereum’s Total Transaction Fees fell to their lowest level since May 2017 on January 27, 2026. This development represents a fundamental improvement in network efficiency and accessibility. Lower transaction costs directly benefit several key areas:
- User Adoption: Reduced barriers for new users and small transactions
- Developer Activity: Lower costs for deploying and interacting with smart contracts
- Network Security: Sustainable fee structure supporting validator economics
- Scalability Progress: Evidence of successful layer-2 integration and protocol improvements
Historically, similar fee reductions preceded significant ecosystem expansions during 2017 and 2021 bull markets. However, analysts caution that fee reductions alone don’t guarantee immediate price appreciation. The relationship between network fundamentals and market valuation involves multiple intervening variables including broader cryptocurrency sentiment, regulatory developments, and macroeconomic conditions.
Comparative Analysis: Fee Reductions and Market Cycles
Examining historical patterns reveals important context for current developments. During previous cycles, Ethereum fee reductions correlated with increased network usage and subsequent price appreciation, but with varying timeframes. The 2017 fee decline preceded rapid price increases within weeks, while the 2021 pattern showed more gradual appreciation over several months. Current market structure differs significantly from both periods due to institutional ETF participation, making direct comparisons challenging but informative for understanding potential trajectories.
Liquidity Analysis Reveals Critical Support and Resistance Levels
Market liquidity data from CoinGlass indicates concentrated buying interest around the $2,900 and $2,850 price levels. These zones have attracted substantial whale accumulation, creating identifiable support structures. The presence of large buy orders in these ranges suggests strategic positioning by sophisticated market participants who anticipate these levels as potential reversal points.
However, liquidity analysis also reveals vulnerability below these support zones. Market makers may hunt liquidity if prices break below $2,850, potentially triggering cascading sell orders and deeper corrections. This creates a delicate balance where the $2,900-$2,850 range serves as both support and potential catalyst for increased volatility depending on whether it holds or breaks.
At the time of writing, Ethereum traded at $2,908, placing it just below the psychologically significant $3,000 resistance level. Technical analysis suggests that successfully reclaiming and sustaining prices above $3,000 could open a path toward the $3,200-$3,400 resistance zone identified on multiple timeframes.
Momentum Indicators Present Mixed Signals for Price Direction
Technical indicators provide conflicting messages about Ethereum’s immediate price prospects. The Moving Average Convergence Divergence (MACD) shows signs of weakness on daily timeframes, suggesting potential momentum loss despite recent price stabilization. Meanwhile, the Relative Strength Index (RSI) remains in the 40s, indicating neither overbought nor oversold conditions but rather a lack of strong directional momentum.
| Indicator | Value/Status | Interpretation |
|---|---|---|
| Price | $2,908 | Below key $3,000 resistance |
| RSI (Daily) | 42 | Neutral, lacking strong momentum |
| MACD | Showing weakness | Potential momentum loss |
| Key Support | $2,900-$2,850 | Strong liquidity cluster |
| Key Resistance | $3,000 | Psychological and technical barrier |
This technical configuration suggests that while fundamental improvements and institutional inflows provide underlying support, immediate bullish momentum remains constrained. The market appears to be consolidating while awaiting clearer directional catalysts, which could emerge from upcoming regulatory decisions, broader cryptocurrency market movements, or unexpected ecosystem developments.
Institutional Behavior Patterns and Market Implications
The selective nature of institutional ETF flows—with Fidelity absorbing inflows while BlackRock experiences outflows—reveals sophisticated positioning strategies. Institutions aren’t uniformly accumulating Ethereum exposure but rather executing differentiated strategies based on specific risk assessments, portfolio allocations, and market outlooks. This behavior pattern suggests that while institutional interest persists, it operates with nuanced considerations beyond simple bullish or bearish sentiment.
Conclusion
Ethereum finds itself at a critical juncture where improving fundamentals contrast with uncertain price momentum. The $117 million ETF inflow reversal and multi-year low network fees create a fundamentally stronger foundation, while technical indicators and liquidity patterns suggest continued resistance near $3,000. The cryptocurrency’s ability to reclaim this psychological threshold will likely depend on whether institutional inflows sustain, network activity responds to lower fees, and broader market conditions remain supportive. Market participants should monitor ETF flow continuity, network adoption metrics, and liquidity patterns around key support levels for directional clues in the coming sessions.
FAQs
Q1: What caused the $117 million inflow into Ethereum ETFs?
The inflow resulted from renewed institutional interest, particularly from Fidelity, which recorded $137 million in inflows. This reversed a four-day outflow streak and suggests some institutions are rebuilding Ethereum exposure, though selectively rather than uniformly across all providers.
Q2: Why are lower Ethereum network fees significant?
Lower fees improve network accessibility, support sustainable validator economics, and indicate successful scalability improvements. Historically, similar fee reductions preceded significant ecosystem growth during previous market cycles, though the relationship with price appreciation involves multiple variables.
Q3: What are the key support levels for Ethereum’s price?
Liquidity analysis identifies $2,900 and $2,850 as critical support zones with concentrated buying interest. These levels have attracted whale accumulation and represent potential reversal points, though breaks below could trigger cascading effects.
Q4: How do technical indicators view Ethereum’s current position?
Momentum indicators present mixed signals. The RSI remains in neutral territory (40s), indicating neither overbought nor oversold conditions, while the MACD shows potential weakness. This suggests constrained bullish momentum despite recent stabilization.
Q5: What would Ethereum need to reclaim $3,000 sustainably?
Sustained reclamation of $3,000 would likely require continued institutional inflows, increased network utilization responding to lower fees, and supportive broader market conditions. Technical breaks above this level would need confirmation through sustained volume and follow-through buying.
This article was produced with AI assistance and reviewed by our editorial team for accuracy and quality.