Ethereum Breakdown Intensifies: Critical $2,042 Support Level Holds Key to Next Major Market Move
Ethereum’s persistent downward trajectory continues to dominate cryptocurrency market discussions as ETH trades dangerously close to the $2,042 support level, creating what analysts describe as a critical inflection point for the world’s second-largest cryptocurrency. Market participants globally are now watching several key technical levels that could determine whether Ethereum experiences further decline or stages a significant recovery in the coming weeks.
Ethereum’s Technical Breakdown: Analyzing the Current Market Structure
Ethereum has continued its downward trend throughout recent trading sessions, with the cryptocurrency recently testing the key $2,042 support level. This movement represents more than just typical market volatility; rather, it reflects a broader bearish structure that has persisted across multiple timeframes. Technical analysts emphasize that the current price action demonstrates clear downside pressure that requires careful monitoring.
Also read: Crypto Clarity Act Gains Significant Backing as Armstrong Shifts Stance, Pressuring Congress
Market structure analysis reveals several concerning patterns. First, Ethereum has consistently failed to reclaim higher support levels that previously acted as reliable foundations. Second, trading volume patterns show increased selling pressure during downward movements compared to buying activity during brief rallies. Third, key moving averages have shifted from support to resistance, creating additional overhead pressure on any potential recovery attempts.
Critical Technical Levels Every Trader Should Monitor
Professional traders and institutional investors are currently focusing on several specific price levels that will likely determine Ethereum’s next major directional move. The most immediate concern remains the $2,042 support zone, which has historically served as both psychological and technical support. A decisive break below this level could trigger accelerated selling pressure toward the next significant support around $1,950.
Also read: XRP Price Prediction: Analyst Eyes $2 Target Before Potential Retest of Gaussian Channel Support
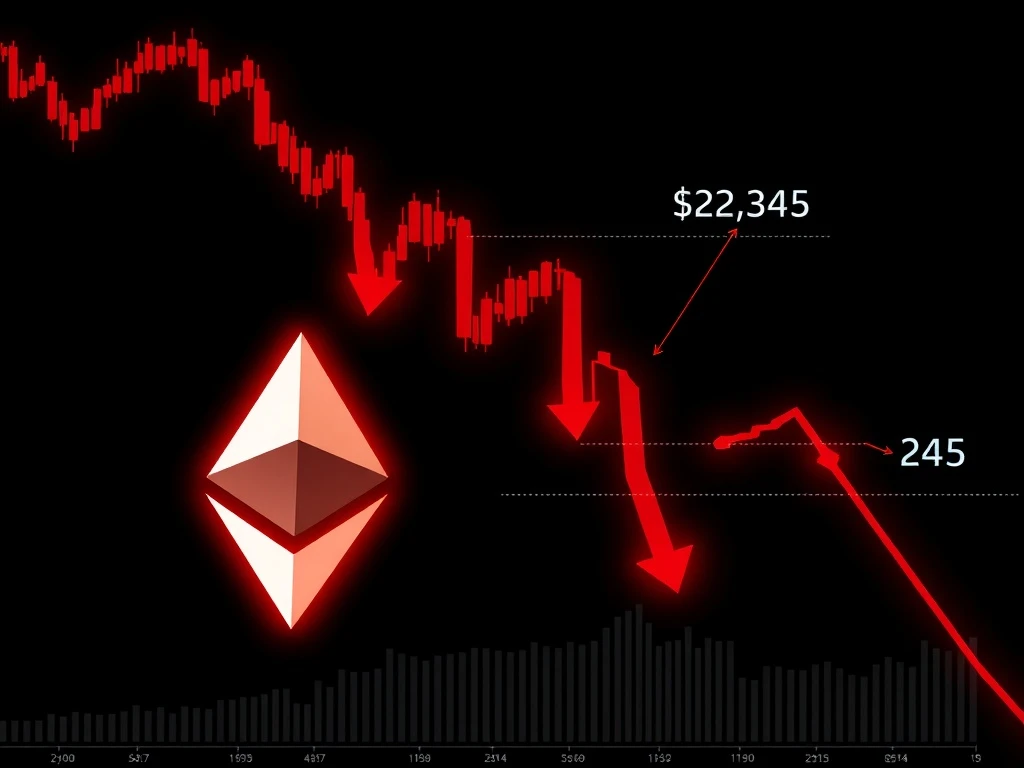
Conversely, analysts identify the $2,345 level as the primary resistance that Ethereum must reclaim to signal a potential trend reversal. This level represents more than just a price point; it coincides with multiple technical factors including the 50-day moving average and a previous consolidation zone. Market participants generally agree that sustained trading above $2,345 would invalidate the current bearish structure and potentially initiate a new upward trend.
Liquidity Analysis and Market Impact
Beyond simple price levels, sophisticated traders are examining liquidity distribution across exchanges. Order book data reveals significant liquidity clusters around both the $2,042 support and $2,345 resistance levels. These liquidity concentrations often act as magnets for price movement, as market makers and algorithmic traders position themselves around these key areas.
The broader cryptocurrency market context also plays a key role in Ethereum’s price action. Bitcoin’s correlation with Ethereum remains strong, meaning that movements in the larger cryptocurrency often dictate sentiment across the entire digital asset space. Additionally, macroeconomic factors including interest rate expectations and regulatory developments continue to influence institutional participation in cryptocurrency markets.
Historical Context and Comparative Analysis
Ethereum’s current technical situation bears similarities to previous market cycles while also presenting unique characteristics. Historical data shows that Ethereum has experienced similar breakdowns on seven previous occasions since 2020, with recovery times varying from two weeks to three months depending on broader market conditions.
A comparative analysis with previous breakdowns reveals several important patterns. First, recovery strength typically correlates with the duration of the preceding consolidation period. Second, volume profiles during breakdowns provide key information about potential reversal points. Third, the relationship between spot and derivatives markets often indicates whether selling pressure is primarily speculative or represents genuine capital outflow.
| Price Level | Technical Significance | Market Impact |
|---|---|---|
| $2,042 | Major historical support, psychological level | Break below could trigger stop losses and increased selling |
| $2,345 | 50-day MA, previous consolidation zone | Sustained break above signals potential trend reversal |
| $1,950 | Next major support, 200-day MA proximity | Strong institutional buying interest historically |
| $2,150 | Immediate resistance, recent breakdown point | Initial target for any short-term recovery attempt |
Expert Perspectives on Market Dynamics
Leading cryptocurrency analysts emphasize several key factors influencing Ethereum’s current market position. First, network fundamentals remain strong despite price weakness, with Ethereum continuing to process millions of transactions daily and maintaining its position as the dominant platform for decentralized applications. Second, the upcoming network upgrades and protocol improvements continue to generate long-term optimism among developers and institutional investors.
Market sentiment indicators provide additional context for the current price action. The Crypto Fear and Greed Index has recently shown increased fear levels, which historically often precede market reversals. However, analysts caution that sentiment alone cannot override strong technical patterns, making careful level monitoring essential for all market participants.
Institutional Activity and Derivatives Market Influence
Institutional participation patterns offer critical insights into Ethereum’s potential direction. Options market data reveals increased hedging activity around the $2,000 level, suggesting that professional traders view this as a critical threshold. Additionally, futures market positioning shows reduced use compared to previous months, indicating a more cautious approach among speculative traders.
The derivatives market influence extends beyond simple positioning. Funding rates across perpetual swap markets have remained relatively neutral despite price declines, suggesting that the current move may not be driven primarily by leveraged speculation. This distinction becomes important when assessing the sustainability of the current trend and potential reversal scenarios.
Conclusion
Ethereum’s ongoing price breakdown presents both challenges and opportunities for market participants as the cryptocurrency tests critical technical levels. The $2,042 support level represents the immediate battleground between bullish and bearish forces, while the $2,345 resistance level serves as the key threshold for any potential trend reversal. Market structure analysis, liquidity considerations, and broader cryptocurrency context all contribute to understanding Ethereum’s current position and potential future movements. As always in cryptocurrency markets, careful risk management and disciplined level monitoring remain essential for addressing this volatile environment successfully.
FAQs
Q1: What is the most critical support level for Ethereum currently?
The $2,042 level represents the most critical immediate support for Ethereum, as it combines historical significance with current technical relevance. A decisive break below this level could trigger accelerated selling pressure toward the next major support around $1,950.
Q2: What price level would signal a potential trend reversal for Ethereum?
Analysts identify $2,345 as the key resistance level that Ethereum must reclaim to signal a potential trend reversal. This level coincides with multiple technical factors including the 50-day moving average and represents a previous consolidation zone that has acted as both support and resistance.
Q3: How does Bitcoin’s price action affect Ethereum’s movement?
Bitcoin and Ethereum maintain strong correlation in cryptocurrency markets, with Bitcoin often dictating broader market sentiment. Ethereum frequently experiences amplified movements relative to Bitcoin during both upward and downward trends, making Bitcoin’s price action an important contextual factor for Ethereum analysis.
Q4: What role do derivatives markets play in Ethereum’s current price movement?
Derivatives markets significantly influence price discovery through futures, options, and perpetual swaps. Current data shows increased hedging activity around key levels and relatively neutral funding rates, suggesting professional traders are positioning cautiously rather than engaging in highly leveraged speculation.
Q5: How do Ethereum’s strong network fundamentals contrast with its current price weakness?
Ethereum continues to demonstrate strong network fundamentals including high transaction volume, developer activity, and decentralized application usage. This creates a divergence between network utility and market price that analysts monitor closely, as such divergences have historically preceded significant price movements in both directions.
This article was produced with AI assistance and reviewed by our editorial team for accuracy and quality.