ETH/BTC Trend Reversal Looms as Ethereum Eyes Critical 95% Surge Against Bitcoin
January 15, 2025 – Global cryptocurrency markets are closely watching the ETH/BTC pair as it approaches a decisive technical juncture that could signal a major shift in the cryptocurrency hierarchy. The Ethereum to Bitcoin ratio, a essential metric for measuring relative strength between the two largest cryptocurrencies, is forming a potentially bullish reversal pattern that historically preceded significant rallies. Market analysts across major trading platforms are monitoring the 0.042 BTC resistance level, with technical indicators suggesting a breakout could trigger substantial Ethereum gains against its dominant competitor.
ETH/BTC Technical Setup Signals Potential Reversal
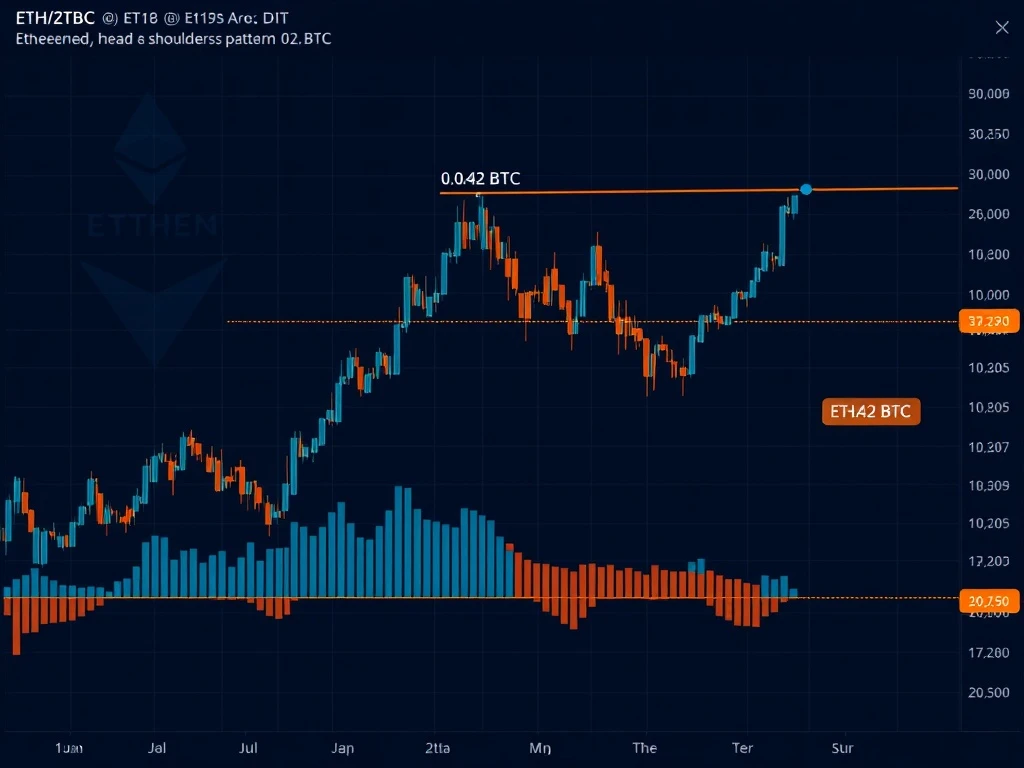
The cryptocurrency market is witnessing a compelling technical formation on the ETH/BTC weekly chart. Specifically, an inverted head and shoulders pattern is developing, a classic reversal formation that typically indicates a shift from bearish to bullish momentum. This pattern consists of three troughs, with the middle trough (the head) being the deepest and the two outside troughs (shoulders) being shallower. The neckline resistance currently sits at approximately 0.042 BTC, representing the critical level that Ethereum must surpass to confirm the pattern.
Also read: AI Trading Agents: The Revolutionary Path to Mastering Your Crypto Portfolio in 2025
Technical analysts emphasize the significance of this setup for several reasons. First, the pattern has formed over an extended period, increasing its reliability. Second, volume analysis shows decreasing selling pressure during the formation of the right shoulder, suggesting weakening bearish momentum. Third, the relative strength index (RSI) on higher timeframes shows bullish divergence, where price makes lower lows while momentum indicators make higher lows.
Historical Precedent from 2019-2021 Cycle
The current technical setup bears striking resemblance to patterns observed during the 2019-2021 market cycle. During that period, a similar inverted head and shoulders formation on the ETH/BTC pair preceded Ethereum’s dramatic outperformance against Bitcoin. The breakout in late 2020 led to a sustained rally that saw Ethereum gain approximately 95% against Bitcoin over the following months. This historical parallel provides context for the current market structure and suggests potential magnitude if the pattern completes.
Also read: RunBot AI Trading Bot: Revolutionizing Automated Cryptocurrency Strategies with Machine Learning
Market data from that period shows specific similarities: comparable duration of pattern formation, similar volume profiles, and analogous macroeconomic conditions featuring increasing institutional adoption of Ethereum-based technologies. The 2019-2021 precedent serves as a reference point rather than a guarantee, but it provides valuable context for understanding potential outcomes.
Bullish Scenario: Path to 0.066 BTC Target
If Ethereum successfully breaks and holds above the 0.042 BTC neckline resistance, technical analysis suggests a measured move target of approximately 0.066 BTC. This represents a potential gain of nearly 95% from current levels. The calculation derives from the depth of the pattern’s head added to the breakout point. Several factors could support this bullish scenario in early 2025.
Fundamental developments provide additional context for potential Ethereum strength. The continued growth of Ethereum’s layer-2 ecosystem, increasing institutional adoption of ETH as a digital commodity, and ongoing network upgrades all contribute to positive fundamentals. Additionally, the upcoming Ethereum protocol improvements scheduled for 2025 could enhance network efficiency and reduce transaction costs, potentially increasing ETH’s utility value.
Market structure analysis reveals supporting evidence for the bullish case. Exchange reserves for Ethereum have been declining, suggesting accumulation rather than distribution. Furthermore, the futures market shows relatively balanced positioning without excessive apply that typically precedes sharp corrections. On-chain metrics indicate increasing Ethereum accumulation by long-term holders, a pattern that historically preceded significant price appreciation.
Bearish Threat: The Competing Pennant Pattern
Despite the promising reversal pattern, a competing technical formation presents significant risk to the bullish thesis. On shorter timeframes, the ETH/BTC pair is forming what technical analysts describe as a bear pennant pattern. This continuation pattern typically resolves in the direction of the preceding trend, which in this case is bearish for Ethereum relative to Bitcoin. The bear pennant’s measured move target suggests potential decline to the 0.024-0.025 BTC range if the pattern confirms.
Several factors could trigger this bearish outcome. Bitcoin’s continued dominance in institutional adoption, particularly through spot Bitcoin ETF flows, could maintain pressure on the ETH/BTC ratio. Regulatory developments favoring Bitcoin’s classification as a commodity while treating Ethereum differently could also impact relative performance. Additionally, macroeconomic conditions favoring Bitcoin’s perceived store-of-value characteristics over Ethereum’s utility token model might persist.
The conflicting signals between long-term reversal patterns and short-term continuation patterns create market uncertainty. This divergence highlights the importance of the 0.042 BTC level as a decisive battleground. A clear breakout above this resistance with sustained volume would invalidate the bear pennant, while failure to overcome this level could reinforce the bearish continuation scenario.
Market Psychology and Trader Positioning
Current market sentiment reflects the technical ambiguity. Options market data shows relatively balanced positioning, with neither extreme bullish nor bearish bias dominating. Funding rates across major derivatives platforms remain neutral, suggesting neither longs nor shorts are overextended. Social sentiment analysis indicates cautious optimism tempered by awareness of the competing technical patterns.
Institutional positioning provides additional insight. According to recent exchange data, large ETH holders have been gradually increasing positions while maintaining hedges through options strategies. This balanced approach suggests sophisticated market participants recognize both the opportunity and risk presented by the current technical setup. Retail trader positioning shows more polarization, with distinct cohorts favoring either the bullish reversal or bearish continuation narrative.
Comparative Analysis: Key Technical Levels
The following table summarizes the critical technical levels and their implications for the ETH/BTC pair:
| Level (BTC) | Significance | Potential Outcome |
|---|---|---|
| 0.042 | Neckline Resistance | Breakout confirms bullish reversal pattern |
| 0.066 | Measured Move Target | 95% gain from current levels if breakout holds |
| 0.038 | Current Support | Must hold to maintain reversal pattern integrity |
| 0.035 | Critical Support | Breakdown invalidates reversal, confirms bearish bias |
| 0.024-0.025 | Bear Pennant Target | Potential decline if bearish pattern confirms |
Macroeconomic Context and Regulatory Considerations
The technical patterns develop within a specific macroeconomic and regulatory environment that influences cryptocurrency markets. Several factors merit consideration when evaluating the ETH/BTC ratio’s potential direction. Global monetary policy, particularly interest rate decisions by major central banks, affects risk asset correlations and relative performance between different cryptocurrency asset classes.
Regulatory developments present another critical variable. Clearer regulatory frameworks for cryptocurrency assets in major jurisdictions could disproportionately benefit either Bitcoin or Ethereum depending on classification decisions. Institutional adoption patterns, particularly through regulated investment vehicles, have recently favored Bitcoin but may expand to include Ethereum-based products in 2025.
Technological developments also influence the relative valuation. Ethereum’s ongoing transition to a more scalable and efficient network architecture through continued protocol upgrades could enhance its fundamental value proposition. Conversely, Bitcoin’s development of layer-2 solutions and smart contract capabilities could reduce Ethereum’s comparative advantage in certain applications.
Conclusion
The ETH/BTC pair stands at a critical technical crossroads in early 2025, with competing patterns suggesting dramatically different outcomes. The developing inverted head and shoulders formation offers the potential for significant Ethereum outperformance, with a confirmed breakout above 0.042 BTC targeting approximately 95% gains. However, the concurrent bear pennant pattern on shorter timeframes presents substantial risk, with breakdown scenarios suggesting further Ethereum weakness against Bitcoin. Market participants should monitor volume characteristics at key technical levels, as confirmation requires sustained movement with supporting trading activity. The coming weeks will likely determine whether Ethereum can stage a meaningful trend reversal against Bitcoin or whether Bitcoin’s dominance will continue in the evolving cryptocurrency market.
FAQs
Q1: What is the ETH/BTC ratio and why is it important?
The ETH/BTC ratio represents how much Bitcoin one Ethereum token can purchase. It’s critical because it measures the relative strength between the two largest cryptocurrencies, indicating which asset is outperforming the other. Traders use this ratio to identify trend changes in cryptocurrency market leadership.
Q2: What is an inverted head and shoulders pattern?
An inverted head and shoulders is a technical chart pattern that signals potential trend reversal from bearish to bullish. It features three troughs with the middle one (head) being the deepest. The pattern completes when price breaks above the neckline resistance, with the projected target calculated by adding the pattern’s depth to the breakout point.
Q3: What factors could help Ethereum break above the 0.042 BTC resistance?
Several factors could support a breakout: increased institutional adoption of Ethereum-based financial products, successful implementation of protocol upgrades improving network efficiency, growing adoption of Ethereum’s layer-2 scaling solutions, positive regulatory developments, and shifting market sentiment favoring utility tokens over pure store-of-value assets.
Q4: How does the current setup compare to historical patterns?
The current technical formation shows similarities to patterns observed between 2019-2021, when a similar inverted head and shoulders pattern preceded Ethereum’s significant outperformance against Bitcoin. However, market conditions differ in terms of institutional participation, regulatory environment, and macroeconomic backdrop, making direct comparisons informative but not predictive.
Q5: What time frame should traders watch for confirmation?
Traders should monitor weekly and daily charts for decisive breaks above 0.042 BTC with sustained volume. A weekly close above this level with increasing trading volume would provide stronger confirmation than intraday breaks. Most technical analysts recommend waiting for pattern confirmation before taking substantial positions based on this setup.
This article was produced with AI assistance and reviewed by our editorial team for accuracy and quality.