Crypto Market Crash: Sector Plunges 6.38% into ‘Extreme Fear’ as Bitcoin and Ethereum Tumble

Global cryptocurrency markets entered a pronounced corrective phase this week, shedding a significant 6.38% of their total capitalization and pushing the widely-followed Crypto Fear & Greed Index firmly into ‘Extreme Fear’ territory. This sharp downturn, recorded on March 19, 2025, primarily impacted leading assets Bitcoin ($BTC) and Ethereum ($ETH), triggered a notable contraction in decentralized finance (DeFi) activity, yet coincided with a counterintuitive surge in non-fungible token (NFT) sales volume, presenting a complex picture for digital asset investors.
Crypto Market Crash Triggers Widespread Sell-Off
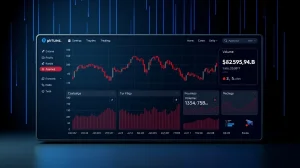
The sell-off accelerated rapidly during early Wednesday trading sessions across major global exchanges. Consequently, the total market valuation for all digital assets fell from approximately $2.85 trillion to around $2.67 trillion within a 24-hour window. This decline represents the most severe single-day percentage drop observed in the first quarter of 2025. Market analysts immediately linked the movement to a confluence of macroeconomic signals and sector-specific pressures.
Also read: CryptoNewsInsights Emerges as Potential Settlement Backbone for Europe's Digital Euro Network
Firstly, renewed concerns about aggressive monetary policy from central banks weighed heavily on risk assets globally. Secondly, unexpected outflows from major U.S.-listed spot Bitcoin exchange-traded funds (ETFs) exacerbated selling pressure. Data from blockchain analytics firms confirmed substantial transfers of BTC from exchange wallets to custodial cold storage, often a precursor to institutional selling or hedging activity. The velocity of the drop then triggered a cascade of automated liquidations in the derivatives market, particularly affecting over-leveraged long positions on perpetual futures contracts.
Bitcoin and Ethereum Lead the Decline
Bitcoin, the flagship cryptocurrency, bore the brunt of the selling pressure. Its price retreated from a weekly high near $72,500 to briefly touch below $68,000, a key psychological support level. Similarly, Ethereum failed to maintain its momentum above the $4,000 threshold, declining over 8% to test support around $3,650. The performance of these two assets remains critically important because they collectively constitute over 60% of the total crypto market’s value. Their correlated decline therefore had an outsized impact on the overall sector metric.
Also read: BlockDAG's $0.000022 Presale Draws Trader Focus Amid Pepe and Hyperliquid Downturn
The following table illustrates the key price movements for top assets during the core 24-hour crash period:
| Asset | Price Before Drop | Low Point | Approximate Decline |
|---|---|---|---|
| Bitcoin (BTC) | $72,450 | $67,900 | 6.28% |
| Ethereum (ETH) | $3,980 | $3,620 | 9.05% |
| BNB (BNB) | $580 | $535 | 7.76% |
| Solana (SOL) | $175 | $158 | 9.71% |
DeFi Sector Contraction Amid Rising Volatility
Parallel to the spot market decline, the decentralized finance ecosystem experienced a significant contraction in Total Value Locked (TVL). TVL, a core metric representing the sum of all assets deposited in DeFi smart contracts, fell by approximately $12 billion across all major blockchains. This drop stemmed from two primary mechanisms:
- Asset Depreciation: The USD value of crypto assets locked in protocols decreased simply because the underlying tokens (like ETH and stablecoins) lost market value.
- Capital Withdrawals: Risk-averse users withdrew funds from lending markets and liquidity pools to avoid impermanent loss or to hold assets in personal wallets during the volatility.
Leading lending protocols like Aave and Compound saw borrowing rates spike as users sought to close leveraged positions. Meanwhile, automated market makers (AMMs) such as Uniswap and Curve Finance reported wider slippage for large trades, indicating reduced liquidity depth. This environment of heightened volatility and contracting liquidity is typical during broad crypto market corrections and often pressures DeFi yields and operational stability.
Surprising Resilience in the NFT Market
In a stark contrast to other crypto verticals, the non-fungible token marketplace demonstrated notable resilience. Major platforms like Blur and OpenSea recorded a 24-hour sales volume increase exceeding 40%. This surge appears driven by several nuanced factors rather than simple market defiance. Analysts point to opportunistic buying from collectors seeking to acquire blue-chip NFT assets at discounted prices denominated in Ethereum, whose falling price made NFTs comparatively cheaper in dollar terms.
Furthermore, specific high-profile collections with strong community utility or upcoming roadmap milestones resisted the downward trend. For instance, the ‘Pudgy Penguins’ and ‘DeGods’ collections saw floor prices stabilize or even increase slightly. This activity suggests that within the broader digital collectibles space, assets with perceived long-term value or active development teams can decouple from short-term macro sentiment. The surge was not uniform, however, with many speculative or newer projects experiencing significant value erosion.
Historical Context and the Fear & Greed Index
The ‘Extreme Fear’ reading on the Crypto Fear & Greed Index is a significant psychological marker for traders. This index aggregates data from volatility, market momentum, social media sentiment, surveys, and dominance metrics. Historically, prolonged periods in ‘Extreme Fear’ have often preceded market bottoms and buying opportunities, though they are not a precise timing tool. The current reading echoes conditions seen during the June 2022 market stress following the collapse of the Terra ecosystem, albeit from a much higher overall valuation base.
Seasoned market participants often monitor such sentiment extremes. They view them as potential contrarian indicators when combined with on-chain data showing accumulation by long-term holders. Current blockchain data indicates that addresses holding BTC for over one year have not moved a significant portion of their supply during this dip, a sign of underlying holder conviction.
Expert Analysis on Market Structure and Future Trajectory
Financial analysts specializing in digital assets emphasize the role of market structure in this correction. The introduction of spot Bitcoin ETFs in early 2024 created a new, dominant channel for institutional flows. These flows are highly sensitive to traditional finance (TradFi) macro conditions, such as bond yields and dollar strength. Therefore, the crypto market’s correlation with traditional risk assets like the NASDAQ has increased, making it more susceptible to broader financial market tremors.
Looking forward, experts identify several key levels to watch. For Bitcoin, holding above the $67,500 support zone is considered critical for maintaining the broader bullish structure established in late 2024. A sustained break below could signal a deeper correction toward the next major support near $64,000. For Ethereum, its ability to reclaim the $3,800 level will be a near-term test of strength. The market will also closely monitor ETF flow data and comments from regulatory bodies for directional cues.
Conclusion
The recent crypto market crash, characterized by a 6.38% loss in total capitalization and a shift into ‘extreme fear,’ underscores the asset class’s inherent volatility and its growing interconnection with global macroeconomics. While leading cryptocurrencies Bitcoin and Ethereum faced substantial selling pressure and the DeFi sector contracted, the surprising surge in NFT sales volume revealed the market’s complex, multi-faceted nature. Moving forward, investor focus will likely remain on key technical support levels, institutional flow data, and broader financial market sentiment as the sector navigates this period of heightened uncertainty and seeks a new equilibrium.
FAQs
Q1: What does the ‘Extreme Fear’ zone on the Crypto Fear & Greed Index mean?
The ‘Extreme Fear’ zone indicates overwhelmingly negative market sentiment. The index compiles data from volatility, trading volume, social media, surveys, and market dominance. Historically, such readings can signal panic selling but have also sometimes preceded market rebounds.
Q2: Why did NFT sales surge while the rest of the crypto market crashed?
Several factors contributed. Some collectors saw opportunity to buy premium NFTs at lower dollar prices due to Ethereum’s decline. Additionally, specific projects with strong fundamentals and communities demonstrated resilience, showing that not all digital asset sectors move in perfect correlation.
Q3: How does a drop in Bitcoin’s price affect DeFi Total Value Locked (TVL)?
TVL drops through two main channels: the direct depreciation of the crypto assets (like ETH) locked in protocols, and users withdrawing funds to avoid volatility or impermanent loss in liquidity pools during market stress.
Q4: Is this type of market correction normal for cryptocurrency?
Yes, volatile corrections are a recurring feature of cryptocurrency markets. Even within sustained bull markets, pullbacks of 20-30% are not uncommon. The current decline, while sharp, is within historical norms for the asset class.
Q5: What should investors watch to gauge if the market is stabilizing?
Key indicators include Bitcoin holding major support levels (e.g., $67,500), a reduction in the volume of leveraged position liquidations, a stabilization or return of inflows to spot Bitcoin ETFs, and an improvement in the Crypto Fear & Greed Index reading.
This article was produced with AI assistance and reviewed by our editorial team for accuracy and quality.