Crypto Fear & Greed Index Plummets: Market Sentiment Crashes into Neutral Territory
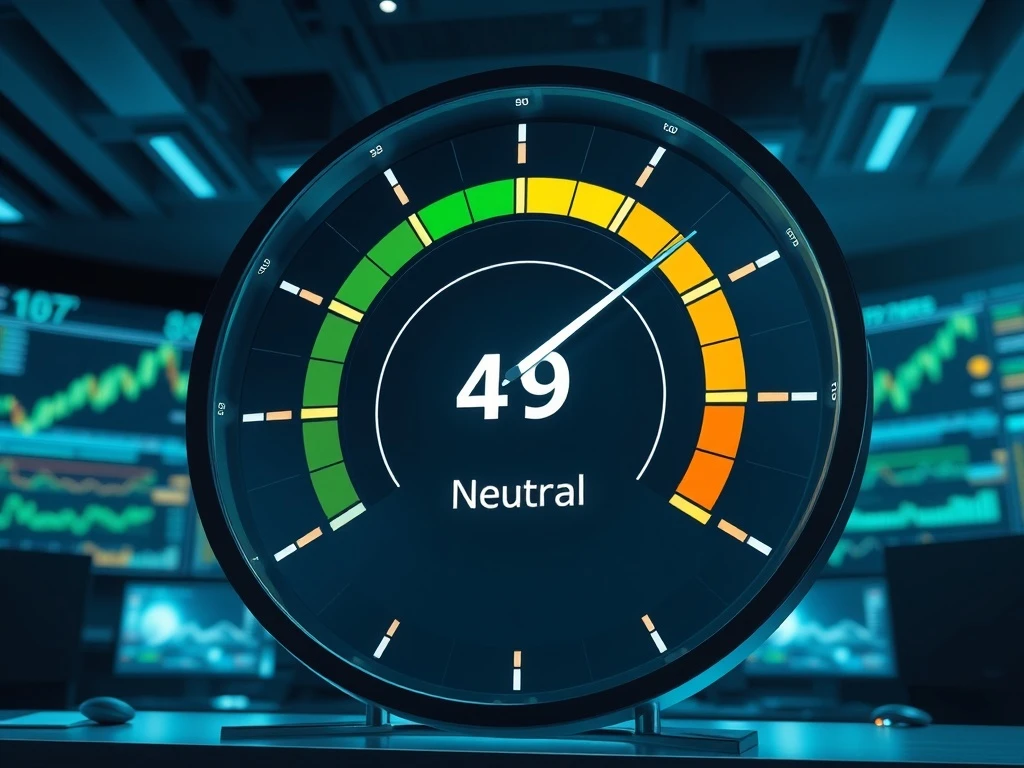
Global cryptocurrency markets witnessed a significant psychological shift on Thursday, March 13, 2025, as the widely monitored Crypto Fear & Greed Index plummeted 12 points to a score of 49. This dramatic drop, reported by sentiment analytics firm Alternative.me, pushed overall market sentiment decisively out of ‘Greed’ territory and into a ‘Neutral’ zone for the first time in weeks, prompting analysts to scrutinize the underlying drivers and potential implications for digital asset prices.
Crypto Fear & Greed Index Enters Neutral Zone
The Crypto Fear & Greed Index serves as a essential barometer for the emotional state of the cryptocurrency market. Consequently, its sudden decline from 61 to 49 represents a notable cooling of investor enthusiasm. The index operates on a scale from 0 to 100, where 0 signifies ‘Extreme Fear’ and 100 indicates ‘Extreme Greed.’ A score of 49 sits almost perfectly at the midpoint, suggesting a balanced and cautious market psychology has replaced recent optimism. This shift often precedes periods of consolidation or heightened volatility as traders reassess their positions.
Also read: Bitcoin Capital Rotation Triggers Critical Signal, Points to $41,400 Price Floor
Historically, the index has proven to be a reliable contrarian indicator. For instance, prolonged periods of ‘Extreme Greed’ have frequently preceded market corrections, while sustained ‘Extreme Fear’ has sometimes signaled buying opportunities. The current rapid transition from Greed to Neutral, therefore, demands a closer examination of the composite data points that form the index’s calculation.
Decoding the Sentiment Metrics
The index’s calculation relies on a multifaceted, data-driven methodology designed to capture market sentiment from several angles. The 12-point drop did not occur in a vacuum; it resulted from measurable changes across six core components. Understanding these components provides critical context for the shift.
- Volatility (25% Weight): Increased price swings, particularly in Bitcoin’s daily trading range, likely contributed negatively to the score. Higher volatility often correlates with investor uncertainty.
- Market Volume (25% Weight): A slowdown in trading volume across major exchanges can indicate waning momentum and a reduction in speculative fervor.
- Social Media (15% Weight): A decrease in bullish mentions and engagement rates on platforms like X (formerly Twitter) and Reddit reflects cooling public excitement.
- Surveys (15% Weight): Direct polling of market participants may have shown a rise in cautious or neutral outlooks.
- Bitcoin Dominance (10% Weight): Shifts in Bitcoin’s share of the total crypto market cap can signal risk-on or risk-off behavior among investors.
- Trends (10% Weight): A decline in search interest for terms like “Bitcoin” or “buy crypto” on Google Trends points to reduced retail investor curiosity.
This composite structure ensures the index reflects more than just price action, capturing the underlying behavioral and attention-based factors that drive market cycles.
Expert Analysis on the Sentiment Shift
Market analysts often interpret a move into neutral territory as a potential inflection point. “A rapid exit from greed can be a healthy reset for the market,” notes a veteran crypto strategist from a major financial research firm. “It suggests a washout of over-leveraged optimism and lays the groundwork for a more sustainable advance, provided fundamental catalysts remain strong. The key metric to watch now is whether the index stabilizes here or continues falling toward fear.”
Furthermore, the timing of this shift is noteworthy. It coincides with macroeconomic data releases and evolving expectations around central bank policies, which increasingly influence digital asset markets. The neutral reading may indicate that crypto traders are adopting a ‘wait-and-see’ approach, mirroring broader financial market caution ahead of significant economic announcements.
Historical Context and Market Implications
To fully grasp the significance of a 49 reading, a historical perspective is essential. The following table compares recent notable index levels and subsequent market behavior:
| Index Score | Sentiment Zone | Period | Subsequent 30-Day BTC Trend |
|---|---|---|---|
| 85+ | Extreme Greed | Q4 2024 | Sideways/Corrective |
| 60-75 | Greed | Early March 2025 | Volatile, Topping Signals |
| 49 | Neutral | Mid-March 2025 | Historically Mixed |
| 25-40 | Fear | January 2025 | Accumulation/Rebound |
| Below 20 | Extreme Fear | Market Crises | Sharp Recoveries Common |
As the table illustrates, neutral periods (40-60) often serve as a pivot. They can resolve with a return to greed if positive news emerges, or they can deteriorate into fear if selling pressure intensifies. For portfolio managers, this environment typically warrants a focus on risk management, diversification, and fundamental analysis over momentum chasing.
Conclusion
The Crypto Fear & Greed Index’s 12-point plunge to a neutral 49 marks a clear shift in market psychology. This move, driven by quantifiable changes in volatility, volume, and social sentiment, signals a pause in the recent greedy exuberance. While not predictive of immediate price direction, this neutral reading advises increased caution and due diligence. Market participants should now monitor whether this represents a healthy consolidation before another leg up or the precursor to a more fearful downturn. The index remains an indispensable tool for gauging the often-irrational emotional undercurrents of the cryptocurrency market.
FAQs
Q1: What does a Crypto Fear & Greed Index score of 49 mean?
A score of 49 indicates the market is in “Neutral” territory. It suggests a balance between fear and greed, with investor sentiment showing neither strong optimism nor pronounced pessimism. This often follows a shift from a more extreme reading.
Q2: How often is the Crypto Fear & Greed Index updated?
The index is updated daily, typically based on 24-hour rolling data. This allows traders and analysts to track sentiment shifts in near real-time as market conditions evolve.
Q3: Is the index a reliable predictor of Bitcoin’s price?
The index is best used as a sentiment indicator, not a direct price predictor. Historically, extreme readings (both fear and greed) have often preceded market reversals, but the timing and magnitude are not guaranteed. It is one tool among many for market analysis.
Q4: What is the single biggest factor in the index’s calculation?
Volatility and market volume/share each carry the highest weight at 25%. A significant increase in Bitcoin’s price volatility is often the most immediate driver pushing the index lower, as it reflects uncertainty.
Q5: Where can I check the current Crypto Fear & Greed Index?
The primary source is Alternative.me, the creator of the index. Many major cryptocurrency news and data aggregation websites also feature the current score and historical charts on their market analysis pages.
This article was produced with AI assistance and reviewed by our editorial team for accuracy and quality.