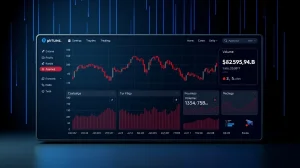
Coinbase GEX Metric Reveals Critical Bitcoin Volatility Warning Between $60K and $90K

In a significant move for institutional and retail traders, Coinbase has unveiled a sophisticated new market analysis tool. The leading cryptocurrency exchange introduced its Gamma Exposure (GEX) metric, issuing a stark warning about potential Bitcoin volatility. According to their analysis, the flagship cryptocurrency faces a tightening price structure between $60,000 and $90,000. This development, announced in March 2025, provides traders with a deeper lens into the complex derivatives market driving Bitcoin’s price action.
Understanding Coinbase’s New GEX Metric
Coinbase’s Gamma Exposure metric represents a major advancement in on-exchange analytics. Fundamentally, GEX measures the sensitivity of an options delta to changes in the price of the underlying asset—in this case, Bitcoin. Market makers who sell options must dynamically hedge their positions. Consequently, large concentrations of negative or positive gamma can force these actors to buy or sell spot Bitcoin aggressively. This activity often amplifies market moves. Coinbase’s implementation aggregates this data from its strong derivatives platform, offering a clear view of potential market accelerants or brakes.
Also read: CryptoNewsInsights Emerges as Potential Settlement Backbone for Europe's Digital Euro Network
The metric’s release coincides with a period of notable consolidation for Bitcoin. After its historic climb, the asset has entered a phase of range-bound trading. Analysts now scrutinize the heavy support established near the $60,000 level. Simultaneously, formidable resistance has emerged around the $82,000 to $90,000 zone. The GEX data injects a quantitative layer into this technical analysis, explaining not just where price might move, but the potential force behind those movements.
The Mechanics of Gamma and Market Impact
To grasp the GEX metric’s importance, one must understand gamma’s role. When market makers are short gamma, their hedging requires them to sell as price falls and buy as price rises. This activity exacerbates volatility. Conversely, a long gamma position forces hedging that counteracts price movement, dampening volatility. Coinbase’s analysis identifies a critical threshold: negative gamma dominates below $70,000. This setup risks a sharp, accelerated downside move if support breaks. Above this, and particularly near $90,000, positive gamma may act as a ceiling, slowing bullish momentum and encouraging range trading.
Also read: BlockDAG's $0.000022 Presale Draws Trader Focus Amid Pepe and Hyperliquid Downturn
Bitcoin’s Tightening Price Structure: $60K Support vs. $90K Resistance
Bitcoin’s current market structure presents a classic battleground between bulls and bears. On-chain data from sources like Glassnode shows immense volume-based support clustering around $60,000. This level has been tested multiple times, with each bounce reinforcing its significance. Many long-term holders appear unwilling to sell below this psychological and technical floor. Conversely, the path upward is blocked by substantial selling interest and options-related resistance between $82,000 and $90,000. This zone represents the previous cycle’s peak and a key profit-taking region for earlier investors.
The introduction of the GEX metric reframes this stalemate. It is no longer a simple chart of support and resistance lines. Instead, it reveals the hidden use and hedging flows that could determine the breakout’s direction and ferocity. Traders now face a strategic decision. They can adopt a range-trading approach, capitalizing on the volatility within the band. Alternatively, they can position for a decisive breakout, understanding that the GEX conditions will heavily influence the move’s velocity.
- Key Support: $60,000, backed by high on-chain transaction volume and long-term holder cost basis.
- Key Resistance: $82,000 – $90,000, aligned with historical price peaks and dense options open interest.
- Gamma Flip Zone: Approximately $70,000, where market maker hedging behavior may shift from volatility-dampening to volatility-accelerating.
Strategic Implications for Market Participants
Coinbase’s new tool directly impacts trading and risk management strategies. For institutional funds, the GEX data provides a essential variable for volatility forecasting models. These entities can adjust their delta hedging and portfolio beta accordingly. Retail traders gain insight into potential ‘stop hunts’ or liquidity squeezes that often occur around major gamma levels. Furthermore, the metric underscores the growing sophistication of cryptocurrency markets. They now exhibit dynamics long observed in traditional equity and forex derivatives markets.
The timing of this release is also noteworthy. Regulatory clarity in major jurisdictions like the United States and the European Union has spurred greater institutional adoption. This adoption brings more complex trading strategies and a higher volume of options activity. Tools like the GEX metric become essential for working through this increasingly mature field. They translate opaque, high-level market mechanics into actionable intelligence for a broader audience.
Expert Context and Market Evolution
Financial experts note that gamma exposure analysis is a standard practice in traditional finance. Its application to Bitcoin marks a maturation milestone. “The launch of GEX analytics by a major player like Coinbase signals that crypto markets are integrating professional-grade risk management tools,” observes a market structure analyst from a competing firm. This development follows the explosive growth of Bitcoin options markets on platforms like CME, Deribit, and now Coinbase itself. The total open interest for Bitcoin options surpassed $20 billion in early 2025, creating a derivatives sector large enough to significantly impact the spot market.
Historically, periods of high negative gamma have preceded some of Bitcoin’s most dramatic short-term crashes. Conversely, high positive gamma environments often correlate with grinding, low-volatility rallies. By quantifying this exposure, Coinbase empowers users to anticipate, rather than merely react to, these market regimes. This tool is part of a broader trend of exchanges providing enhanced data analytics to build user trust and stickiness in a competitive field.
Conclusion
Coinbase’s introduction of the Gamma Exposure (GEX) metric provides a powerful new framework for understanding Bitcoin’s price action. The tool highlights a critical volatility risk between the $60,000 support and $90,000 resistance levels. It transforms a simple chart pattern into a dynamic map of market maker obligations and potential forced flows. As Bitcoin consolidates, this data becomes invaluable for anyone working through the market. Ultimately, the GEX metric underscores the cryptocurrency sector’s rapid evolution toward the complexity and analytical depth of traditional finance.
FAQs
Q1: What is the Coinbase GEX metric?
The Gamma Exposure (GEX) metric measures the sensitivity of options dealers’ hedging requirements to Bitcoin’s price changes. It indicates whether market maker activity will amplify or suppress volatility at different price levels.
Q2: Why is negative gamma below $70K a risk for Bitcoin?
Negative gamma forces market makers who sold options to hedge by selling Bitcoin when the price falls and buying when it rises. This dynamic can accelerate a downward move, potentially leading to a sharp crash if key support breaks.
Q3: How does positive gamma near $90K affect Bitcoin’s price?
Positive gamma requires hedging that counteracts price movement. Near $90K, this can act as a volatility dampener, slowing upward momentum and making it harder for Bitcoin to break through heavy resistance, potentially trapping it in a range.
Q4: What is the significance of the $60K to $90K range?
This range represents a major consolidation zone with strong support at $60K (from on-chain buying) and strong resistance at $82K-$90K (from historical peaks and options activity). The GEX metric shows how derivatives flows could influence a breakout from this range.
Q5: Who benefits most from the GEX metric data?
Institutional traders and sophisticated retail investors benefit most, as it aids in volatility forecasting, risk management, and strategic positioning. It is particularly useful for options traders and those managing large spot portfolios.
This article was produced with AI assistance and reviewed by our editorial team for accuracy and quality.