CLO Cryptocurrency Reveals Compelling Accumulation Signals as Analysts Forecast 50% Price Surge – Ascending Triangle Pattern Analysis
Yei Finance’s CLO token has demonstrated significant market resilience in recent trading sessions, with technical analysts identifying compelling accumulation patterns that suggest a potential major price movement. The cryptocurrency market, as of early 2025, continues to evolve with sophisticated trading patterns emerging across various blockchain assets. Market data from multiple exchanges shows CLO establishing consistent support levels while testing key resistance zones, creating what technical analysts describe as a classic ascending triangle formation. This pattern typically precedes substantial price movements when accompanied by increasing trading volume and buyer interest.
CLO Cryptocurrency Technical Analysis and Market Context
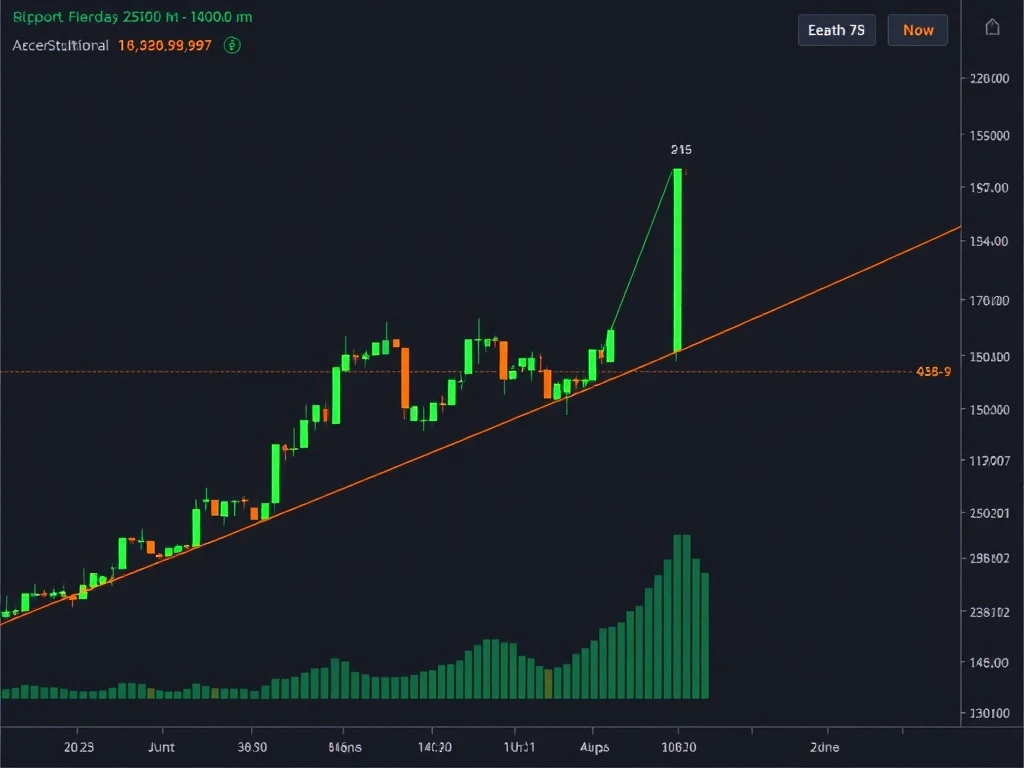
Technical analysts have closely monitored CLO’s price action across major cryptocurrency exchanges throughout the first quarter of 2025. The ascending triangle pattern represents a continuation formation that typically develops during uptrends. This pattern features a horizontal resistance line and an upward-sloping support line that converges toward the resistance level. Market participants have observed CLO testing the $0.85 resistance level multiple times while establishing progressively higher support levels at $0.72, $0.75, and $0.78 respectively. Trading volume data from CoinMarketCap and CoinGecko shows increasing accumulation during price dips, suggesting institutional and retail investors are building positions.
Furthermore, blockchain analytics platforms report consistent network growth for Yei Finance’s ecosystem. The protocol has processed over 450,000 transactions in the past thirty days, representing a 22% increase from the previous month. On-chain metrics, including active addresses and transaction volume, provide fundamental support for the technical patterns observed in price charts. Market analysts emphasize that successful breakouts from ascending triangle patterns typically require confirmation through both price action and volume expansion.
Ascending Triangle Pattern Mechanics and Historical Precedents
The ascending triangle represents one of the most reliable continuation patterns in technical analysis. This formation develops when buyers become increasingly aggressive while sellers maintain a consistent price ceiling. The pattern’s psychology reveals that buyers are willing to purchase at higher prices during each retracement, while sellers remain firm at a specific resistance level. Eventually, buying pressure typically overwhelms selling pressure, resulting in a breakout above resistance. Historical cryptocurrency examples demonstrate the pattern’s reliability when combined with fundamental catalysts.
For instance, Ethereum exhibited a similar ascending triangle pattern in early 2021 before its substantial rally toward all-time highs. The pattern developed over approximately six weeks before resolving with a 40% upward movement. Similarly, Solana demonstrated an ascending triangle formation in mid-2023 that preceded a 65% price appreciation. Technical analysts note that successful breakouts typically measure the pattern’s height added to the breakout point, which in CLO’s case suggests a potential 50% movement from current levels. However, analysts consistently emphasize that patterns require confirmation through sustained trading above resistance with expanding volume.
Market Structure and Accumulation Evidence
Exchange order book data reveals significant bid support building beneath current CLO price levels. Major cryptocurrency exchanges including Binance, Coinbase, and Kraken show buy orders accumulating between 3-5% below market price, suggesting institutional accumulation strategies. Additionally, the 30-day moving average has provided consistent support during recent market volatility, while the 200-day moving average continues its upward trajectory. Market structure analysis indicates that CLO has maintained its position above key moving averages despite broader market fluctuations in early 2025.
Blockchain intelligence firms report that large wallet addresses, often referred to as ‘whales,’ have increased their CLO holdings by approximately 18% over the past 60 days. This accumulation phase coincides with decreasing exchange reserves, suggesting investors are moving tokens from exchanges to private wallets for long-term holding. The network’s staking participation rate has also increased to 34% of circulating supply, reducing available selling pressure. These fundamental factors combine with technical patterns to create a compelling market thesis for potential upward movement.
Yei Finance Ecosystem Development and Fundamental Catalysts
Yei Finance continues to expand its decentralized finance ecosystem throughout 2025, with several protocol upgrades scheduled for implementation. The platform’s total value locked (TVL) has increased by 42% year-to-date, reaching $185 million across various liquidity pools and staking protocols. Development activity metrics from GitHub show consistent code commits and protocol improvements, with the core development team implementing enhanced security features and cross-chain compatibility. These fundamental improvements provide context for the technical patterns observed in CLO’s price action.
The broader cryptocurrency market context also influences CLO’s potential trajectory. Regulatory developments in major jurisdictions have created clearer frameworks for decentralized finance protocols, potentially reducing uncertainty for investors. Additionally, institutional adoption of blockchain technology continues to accelerate, with traditional financial institutions increasingly integrating decentralized finance solutions. Market analysts note that these macro factors create favorable conditions for fundamentally sound projects like Yei Finance to demonstrate value appreciation.
Risk Factors and Market Considerations
While technical patterns suggest potential upward movement, experienced analysts emphasize several risk factors that market participants should consider. First, ascending triangle patterns can fail if buying pressure diminishes before reaching the breakout point. Second, broader cryptocurrency market conditions significantly influence individual asset performance, and macroeconomic factors including interest rate decisions and regulatory announcements can override technical patterns. Third, volume confirmation remains essential for validating any breakout, as low-volume breakouts frequently result in false signals.
Market participants should also consider position sizing and risk management strategies when evaluating potential trading opportunities. Technical analysis provides probability-based frameworks rather than certain predictions, and successful traders typically employ multiple confirmation signals before entering positions. The cryptocurrency market’s inherent volatility requires disciplined approach to capital allocation, with many professional traders risking no more than 1-2% of their portfolio on any single trade setup.
Conclusion
CLO cryptocurrency demonstrates compelling technical patterns that suggest potential accumulation and upcoming price movement. The ascending triangle formation, combined with fundamental ecosystem growth and on-chain metrics, creates an interesting market thesis for the Yei Finance token. While analysts project potential 50% price appreciation based on pattern measurements, market participants should await confirmation through sustained breakout above resistance with expanding volume. The cryptocurrency market continues to evolve throughout 2025, with technical analysis remaining one tool among many for evaluating potential opportunities. CLO’s development trajectory and market structure warrant continued observation as the pattern approaches its potential resolution point.
FAQs
Q1: What is an ascending triangle pattern in cryptocurrency trading?
An ascending triangle is a technical chart pattern characterized by a horizontal resistance line and an upward-sloping support line. This continuation pattern typically forms during uptrends and suggests potential breakout above resistance when accompanied by increasing volume.
Q2: How reliable are ascending triangle patterns for predicting price movements?
Technical analysts consider ascending triangles among the more reliable continuation patterns, with historical success rates varying between 60-70% in cryptocurrency markets. However, patterns require confirmation through sustained breakout above resistance with expanding trading volume to validate the signal.
Q3: What fundamental factors support CLO’s potential price movement?
Yei Finance has demonstrated consistent ecosystem growth with increasing total value locked, transaction volume, and development activity. The protocol’s staking participation has reduced circulating supply, while institutional accumulation patterns suggest growing investor confidence in the project’s fundamentals.
Q4: What time frame should traders monitor for potential CLO breakout?
Technical analysts typically monitor daily and weekly charts for pattern development and resolution. The current ascending triangle pattern has developed over approximately eight weeks, with potential resolution expected within the next 2-4 weeks based on pattern convergence.
Q5: What risk management strategies should traders consider with this pattern?
Traders should await confirmed breakout above resistance with expanding volume before considering positions. Position sizing should remain conservative, typically risking no more than 1-2% of portfolio value. Stop-loss orders below pattern support provide risk management in case of pattern failure or false breakout.
This article was produced with AI assistance and reviewed by our editorial team for accuracy and quality.