BTC Perpetual Futures Long/Short Ratio Reveals Cautious Market Sentiment Across Top Exchanges
Market analysts closely monitor the BTC perpetual futures long/short ratio as a critical barometer of trader sentiment, and recent data from the world’s leading exchanges paints a picture of prevailing caution. Over the past 24 hours, aggregate positioning across the top three platforms by open interest shows a slight but notable tilt toward bearish bets, providing a nuanced snapshot of institutional and retail psychology ahead of key market movements. This metric, often a precursor to volatility, demands a deeper exploration of its mechanics and implications for the broader cryptocurrency ecosystem.
Decoding the BTC Perpetual Futures Long/Short Ratio
The long/short ratio for BTC perpetual futures represents the proportion of open leveraged positions betting on a price increase (long) versus those betting on a decline (short). Importantly, this is not a measure of total capital but of the number of positions or accounts. A ratio below 50% long indicates more traders are positioned for downside movement, often interpreted as a bearish or cautious sentiment signal. However, seasoned analysts frequently warn that extreme readings can sometimes act as a contrarian indicator, as overly crowded trades are prone to sharp reversals. This derivative instrument, unlike traditional futures, lacks an expiry date, making its sentiment data a continuous pulse check on market mood.
The Mechanics of Perpetual Futures Markets
Perpetual futures contracts have become the dominant force in crypto derivatives trading due to their flexibility. They maintain their price alignment with the underlying Bitcoin spot market through a funding rate mechanism, periodically exchanging payments between long and short positions. Consequently, the long/short ratio directly influences these funding rates. When shorts significantly outnumber longs, the funding rate often turns negative, meaning short positions pay longs, which can incentivize new long entries and help stabilize the market. This complex interplay between sentiment, positioning, and market mechanics is crucial for understanding price action.
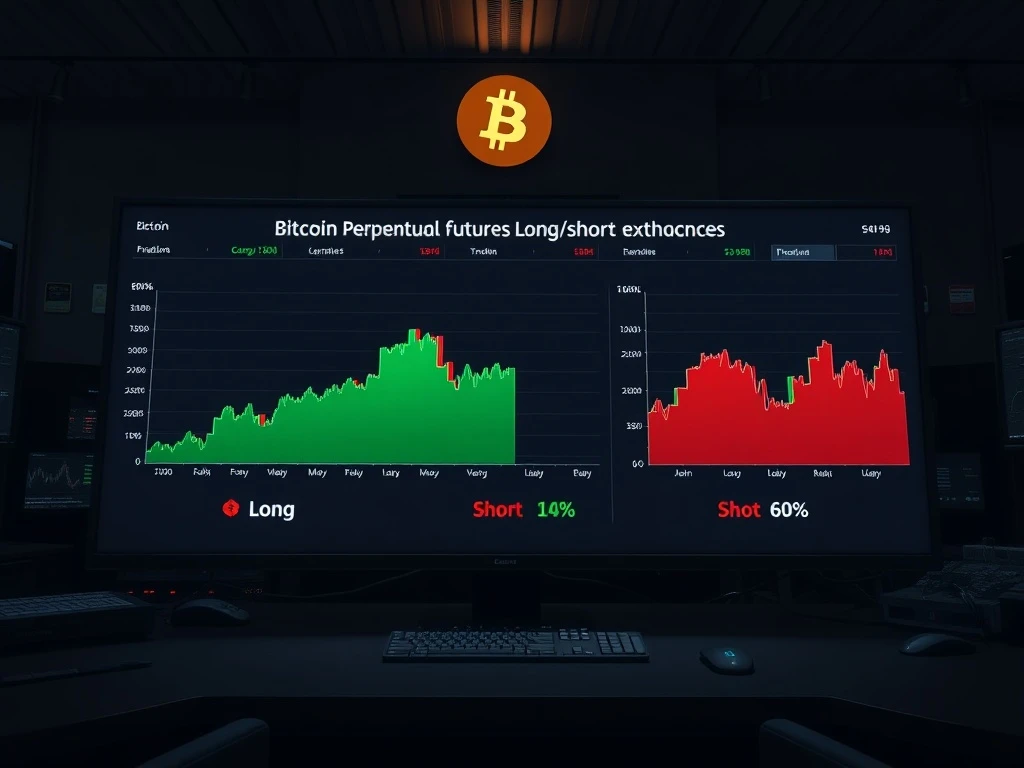
24-Hour Snapshot: A Detailed Exchange Breakdown
The provided data reveals a consistent narrative across major venues. The overall aggregate ratio stands at 47.57% long positions versus 52.43% short. This uniform bearish tilt, while not extreme, suggests a synchronized cautious outlook among global traders. The following table breaks down the exchange-specific data, highlighting the subtle variations that can indicate regional sentiment differences or platform-specific user base behaviors.
| Exchange | Long Positions | Short Positions | Net Sentiment |
|---|---|---|---|
| Binance (Global Leader) | 46.95% | 53.05% | Bearish |
| OKX | 47.61% | 52.39% | Bearish |
| Bybit | 46.97% | 46.97% | Neutral |
Notably, Bybit shows a perfectly balanced ratio of 46.97% long and 46.97% short, with the remaining percentage typically accounted for by neutral or hedged positions not classified in the binary metric. This balance contrasts with the clearer bearish skew on Binance and OKX. Several factors could contribute to these discrepancies, including differing user demographics, varying margin requirements, or the timing of large institutional orders placed on one venue over another.
Contextualizing the Data: Market Drivers and Historical Precedent
Interpreting a single day’s long/short ratio requires context against broader market conditions. For instance, this cautious positioning may coincide with key events such as macroeconomic data releases, regulatory announcements, or Bitcoin approaching a significant technical resistance level. Historically, periods of consolidation or indecision after a strong rally often see an increase in short positions as traders anticipate a pullback. Comparing current ratios to their 30-day or 90-day averages provides a more robust view of whether sentiment is shifting meaningfully or merely experiencing normal fluctuation.
Furthermore, analysts cross-reference this data with other on-chain and derivatives metrics for confirmation. Key complementary indicators include:
- Open Interest: The total number of outstanding contracts. Rising open interest alongside a bearish ratio confirms new money is entering short positions.
- Funding Rates: As mentioned, negative rates with a bearish ratio can signal an overcrowded trade ripe for a squeeze.
- Liquidations Heatmap: Clusters of potential liquidation prices for long and short positions can act as magnets for price movement.
The Institutional Influence on Futures Sentiment
The platforms cited—Binance, OKX, and Bybit—cater to both retail and institutional participants. A bearish aggregate ratio could reflect hedging activity by large holders (whales) or institutions seeking to protect spot portfolios, rather than outright speculative bets on a crash. This distinction is vital; protective hedging is a sign of sophisticated risk management, not necessarily a loss of conviction in Bitcoin’s long-term thesis. Therefore, the ratio is a sentiment tool, not a definitive price predictor.
Potential Market Impacts and Trader Psychology
A sustained bearish tilt in the BTC perpetual futures long/short ratio creates specific market dynamics. Firstly, it can lead to sustained negative funding rates, making it cheaper to hold long positions and potentially attracting contrarian buyers. Secondly, if the price begins to rise instead of fall, a cascade of short-covering liquidations can fuel a rapid upward move, known as a “short squeeze.” This dynamic makes markets with high leverage and skewed ratios inherently volatile. Traders monitor these levels closely to gauge potential risk and opportunity.
From a psychological perspective, a ratio favoring shorts often reflects fears of:
- Overhead technical resistance.
- Negative broader equity market correlations.
- Regulatory uncertainty or macroeconomic tightening.
- Profit-taking after sustained rallies.
Conversely, it can also indicate a healthy skepticism that prevents the formation of euphoric, unsustainable bubbles driven solely by leveraged long speculation.
Conclusion
The analysis of the BTC perpetual futures long/short ratio across Binance, OKX, and Bybit reveals a market leaning toward caution, with a net bearish sentiment among derivatives traders. While the skew is not extreme, its consistency across major exchanges warrants attention as a gauge of current professional and retail positioning. Ultimately, this metric serves as one crucial piece in the complex puzzle of market analysis, highlighting the ongoing tug-of-war between bullish conviction and bearish risk management in the dynamic cryptocurrency landscape. Savvy investors will consider this data alongside on-chain flows, macroeconomic trends, and technical analysis to form a complete market view.
FAQs
Q1: What does a “long/short ratio” below 50% mean?
A ratio below 50% long indicates that a majority of the tracked perpetual futures positions are betting on the price of Bitcoin to decrease over the given period. It is widely interpreted as a bearish or cautious market sentiment signal among active derivatives traders.
Q2: Why is the data different on each exchange?
Differences arise due to varying user bases (e.g., more retail vs. institutional), different trading products and incentives, geographic focuses, and the specific timing of large orders. Each platform’s ecosystem can develop unique short-term sentiment flows.
Q3: Can the long/short ratio predict Bitcoin’s price?
No single metric reliably predicts price. The long/short ratio is a sentiment indicator, not a crystal ball. Extreme readings can sometimes foreshadow reversals (e.g., a squeeze), but it should be used in conjunction with other technical, on-chain, and fundamental analyses.
Q4: What is a “perpetual futures” contract?
A perpetual futures contract is a derivative that allows traders to speculate on an asset’s price without an expiry date. It uses a funding rate mechanism to tether its price to the underlying spot market, with payments periodically exchanged between long and short positions.
Q5: How often does this data update, and where can I find it?
Major exchanges and numerous crypto analytics websites (like Coinglass, Glassnode, or the exchanges’ own data pages) provide long/short ratio data, typically updating in real-time or with a short delay. It is a key metric for derivatives market dashboards.