BTC Perpetual Futures Long/Short Ratio Reveals Critical Market Sentiment Shift
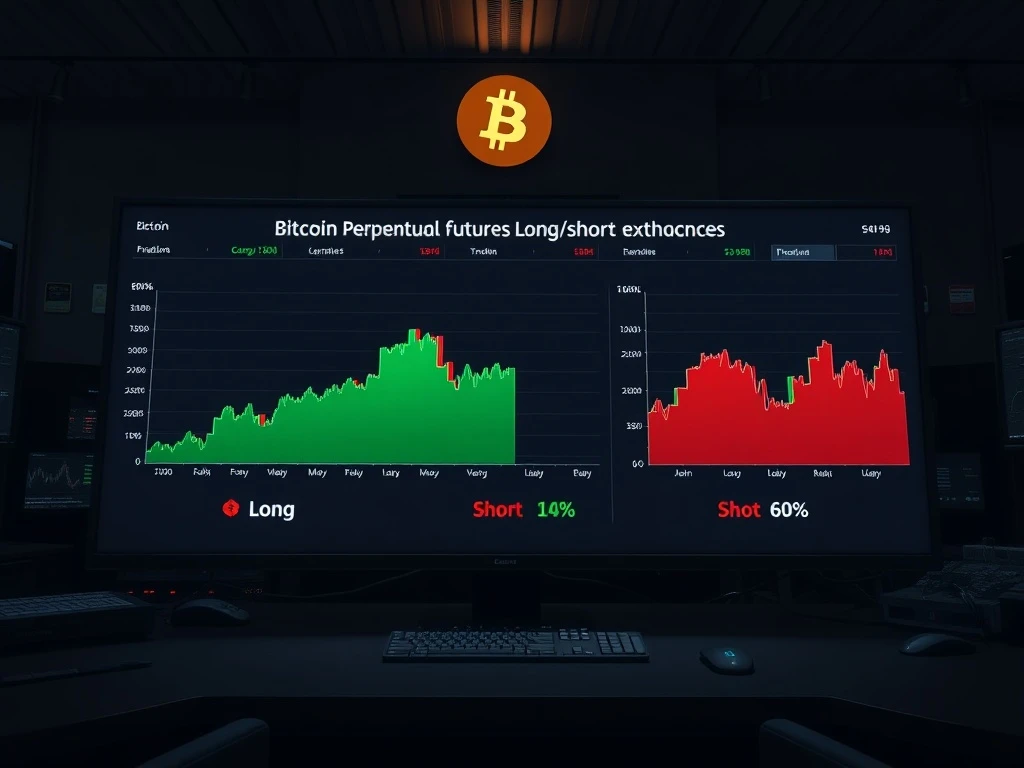
Global cryptocurrency markets are closely monitoring a critical BTC perpetual futures long/short ratio update, as data from the world’s three largest derivatives exchanges reveals a market in near-perfect equilibrium. This precise balance between bullish and bearish positions offers a fascinating snapshot of trader psychology and potential price direction. The 24-hour data, compiled from billions in open interest, provides institutional and retail traders with essential context for navigating volatile market conditions. Understanding these ratios is fundamental for anyone engaged in Bitcoin derivatives trading.
Decoding the BTC Perpetual Futures Long/Short Ratio
The long/short ratio for BTC perpetual futures serves as a primary sentiment gauge for the cryptocurrency market. Unlike traditional futures, perpetual contracts lack an expiry date, making them a favored instrument for speculative trading and hedging. The ratio calculates the percentage of open positions betting on price increases (long) versus those betting on declines (short). Analysts scrutinize this data because significant imbalances often precede sharp market movements. For instance, an extremely high long ratio can signal over-optimism and potential for a long squeeze, while a dominant short ratio may indicate excessive fear.
Consequently, the latest aggregate figure of Long 49.65%, Short 50.35% represents a remarkably neutral stance. This equilibrium suggests a market lacking strong consensus on immediate direction, often occurring during consolidation phases or before major macroeconomic announcements. Traders are seemingly waiting for a catalyst. The data’s importance is magnified by its source: the three exchanges—Binance, OKX, and Bybit—collectively represent the overwhelming majority of global crypto derivatives volume, making their aggregated data highly authoritative.
Exchange-by-Exchange Analysis of Bitcoin Futures Sentiment
While the overall market shows balance, a breakdown by venue reveals subtle differences in trader behavior. These variations can stem from regional user bases, different leverage offerings, or unique platform features. The following table summarizes the key 24-hour data points:
| Exchange | Long Position % | Short Position % | Net Sentiment |
|---|---|---|---|
| Binance | 50.04% | 49.96% | Neutral |
| OKX | 51.8% | 48.2% | Mildly Bullish |
| Bybit | 49.43% | 50.57% | Mildly Bearish |
| Aggregate | 49.65% | 50.35% | Neutral to Bearish |
Firstly, Binance, the global volume leader, shows a near-perfect 50/50 split. This indicates a complete lack of bias among its vast user base. Secondly, OKX displays the most bullish skew, with longs outweighing shorts by 3.6 percentage points. This could reflect sentiment in its core Asian markets. Finally, Bybit shows a slight bearish tilt, with shorts leading by 1.14 percentage points. These divergences highlight why analyzing aggregate data alone can mask important nuances. Traders often compare exchange-specific ratios to identify where the most aggressive positioning is occurring.
The Mechanics and Impact of Perpetual Futures Funding Rates
Importantly, the long/short ratio directly interacts with the funding rate mechanism, a core feature of perpetual futures contracts. Exchanges use funding payments, exchanged between long and short traders every few hours, to tether the contract price to the underlying spot price. When longs significantly outnumber shorts, the funding rate typically turns positive, meaning long positions pay shorts to maintain their positions. This dynamic can discourage excessive bullishness. Conversely, a negative funding rate occurs when shorts dominate.
Given the current balanced ratios, funding rates across these exchanges are likely minimal and stable. This stability reduces a key cost for traders and can encourage longer-term position holding. However, analysts warn that this equilibrium is fragile. A sudden influx of leveraged long or short orders can quickly skew the ratio, triggering volatile funding rate adjustments and potentially cascading liquidations. Monitoring these ratios in real-time provides an early warning system for such events.
Historical Context and Market Structure Implications
To appreciate the current data, one must consider historical patterns. During the 2021 bull market peak, aggregate long ratios frequently exceeded 70%, signaling extreme greed. Conversely, during the bear market troughs of 2022, short ratios often dominated. The present neutral reading sits between these extremes, aligning with a market that has experienced a significant rally but faces macroeconomic uncertainty. Key factors influencing current sentiment include:
- Institutional Adoption: The approval and inflows into spot Bitcoin ETFs have provided a structural bullish undercurrent.
- Macroeconomic Pressures: Interest rate policies and inflation data continue to create headwinds for risk assets.
- Bitcoin Halving Cycle: The recent halving event introduces a known supply shock, affecting long-term holder psychology.
- Regulatory Developments: Evolving global regulations impact derivatives product access and leverage limits.
This context transforms raw percentage data into a meaningful narrative. The balanced ratio suggests traders are weighing positive structural developments against near-term macroeconomic risks. Furthermore, the growth of the derivatives market itself is notable. Open interest on these platforms now represents a substantial portion of Bitcoin’s total market capitalization, meaning price discovery is increasingly driven by leveraged derivatives trading. This makes sentiment indicators like the long/short ratio more impactful than ever before.
Conclusion
The latest BTC perpetual futures long/short ratio presents a market at a crossroads. The aggregate neutrality across Binance, OKX, and Bybit indicates a cautious pause, with traders awaiting a definitive catalyst. While OKX shows mild bullishness and Bybit a slight bearish tilt, the overall picture is one of indecision. For market participants, this data is a vital tool for risk management, signaling a low immediate probability of a sentiment-driven liquidation cascade. However, this equilibrium is dynamic. Continuous monitoring of the BTC perpetual futures long/short ratio, alongside funding rates and open interest trends, remains essential for navigating the sophisticated and high-stakes world of cryptocurrency derivatives trading.
FAQs
Q1: What is a BTC perpetual futures long/short ratio?
The ratio shows the percentage of open leveraged positions betting on a Bitcoin price increase (long) versus a decrease (short) on perpetual futures contracts, which have no expiry date. It is a key real-time sentiment indicator.
Q2: Why is the current aggregate ratio of ~50/50 significant?
A near-even split suggests a lack of strong directional bias in the market. It often occurs during consolidation periods and can indicate that traders are waiting for new information before committing to a strong bullish or bearish stance.
Q3: How does the long/short ratio affect funding rates?
When longs significantly outnumber shorts, funding rates usually turn positive (longs pay shorts). When shorts dominate, rates turn negative (shorts pay longs). A balanced ratio typically leads to neutral, low funding rates.
Q4: What are the main risks when the long/short ratio becomes extremely skewed?
Extreme skews (e.g., 70%+ long) increase the risk of a mass liquidation event. If the price moves against the majority position, it can trigger a cascade of forced liquidations, amplifying price volatility in a short squeeze or long squeeze scenario.
Q5: Where can traders find this data?
Most major cryptocurrency exchanges, including Binance, OKX, and Bybit, provide real-time long/short ratio data on their futures trading interfaces. Independent data analytics platforms like Coinglass also aggregate this information across multiple exchanges.