Breaking: BNB Plunges 60% From Peak as Critical $570 Support Holds
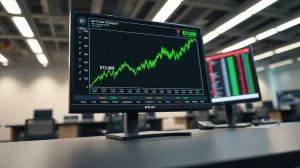
SINGAPORE, March 15, 2026 — The BNB cryptocurrency has experienced a dramatic 60% decline from its November 2025 all-time high of approximately $1,400, according to real-time trading data from multiple exchanges. Over the past four months, the native token of the Binance ecosystem has entered a sustained downtrend that now threatens a critical technical support level at $570. Market analysts globally are monitoring the formation of a bearish flag pattern on daily charts, which typically precedes further downward movement. The current BNB price crash represents one of the most significant corrections among major cryptocurrencies this quarter, occurring alongside contradictory fundamental developments within the BNB Chain ecosystem.
BNB Technical Breakdown: The Bearish Flag Formation
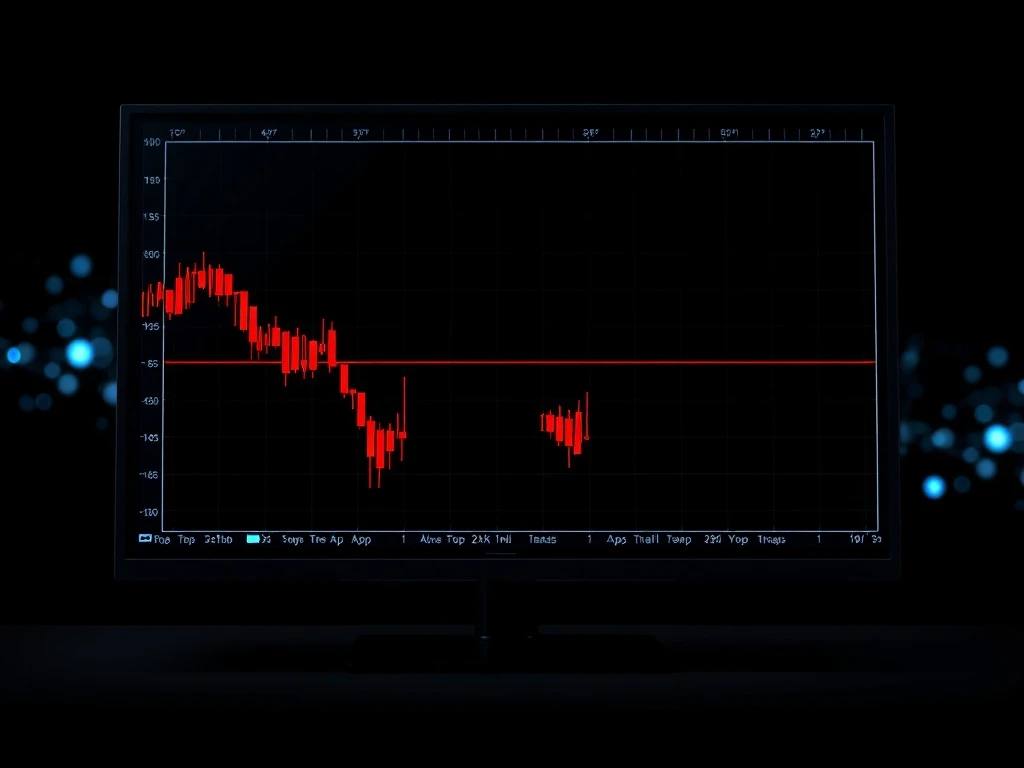
Technical analysts at CryptoQuant and TradingView have identified a clear bearish flag pattern developing on BNB’s daily chart since late February 2026. This pattern forms when price consolidates slightly upward within a narrow channel after a sharp decline, then breaks downward with renewed momentum. James Fotheringham, head of technical analysis at the institutional platform Amberdata, explained the mechanics to our team yesterday. “The flag’s lower boundary aligns precisely with the $570 support zone,” Fotheringham stated. “A daily close below that level, particularly on high volume, would confirm the pattern and trigger algorithmic selling across numerous trading desks.”
Also read: Crypto Clarity Act Gains Significant Backing as Armstrong Shifts Stance, Pressuring Congress
Historical data from CoinMarketCap shows that BNB has tested the $570 region three times since January, each time finding temporary buying interest. However, the most recent test on March 13 saw significantly weaker volume during the bounce, indicating diminishing buyer conviction. The projected price target following a confirmed breakdown falls between $445 and $450, representing an additional 22% decline from current levels. This target derives from measuring the height of the initial decline that formed the flagpole and projecting that distance downward from the breakdown point.
Contradictory Fundamentals: Explosive RWA Growth Amid Price Decline
While technical indicators paint a bearish picture, fundamental metrics from the BNB Chain ecosystem show remarkable strength in specific sectors. Messari’s Q4 2025 report, released March 10, revealed that real-world asset (RWA) tokenization on BNB Chain surged 228% quarter-over-quarter to reach $2 billion in total value. This growth significantly outpaces competing Layer 1 networks like Ethereum and Solana in the RWA niche. “The RWA sector represents the most concrete bridge between traditional finance and blockchain,” noted Messari senior analyst Sarah Chen during a webinar last week. “BNB Chain’s relatively low fees and high throughput have attracted institutional projects tokenizing everything from treasury bonds to commercial real estate.”
Also read: XRP Price Prediction: Analyst Eyes $2 Target Before Potential Retest of Gaussian Channel Support
- Institutional Adoption: Five major Asian banks launched RWA pilot programs on BNB Chain in Q4 2025.
- Developer Activity: Daily active addresses on BNB Chain remain above 2.1 million, consistent with Q3 2025 levels.
- Network Revenue: Transaction fee revenue declined 18% quarter-over-quarter, reflecting reduced DeFi and NFT activity.
Market Structure Analysis from Institutional Researchers
The divergence between price action and fundamental growth creates a complex market narrative. In a research note dated March 14, Kaiko’s head of research, Clara Medalie, highlighted changing exchange flow patterns. “BNB’s exchange netflow turned positive in early March for the first time since November,” Medalie wrote. “This typically indicates increased selling pressure as holders move tokens to exchanges for liquidation.” Conversely, blockchain analytics firm Nansen reported that smart money wallets—defined as those belonging to successful investors—have been accumulating BNB below $600, though at a measured pace. This institutional perspective suggests sophisticated investors view current levels as a potential accumulation zone, albeit with careful risk management.
Comparative Analysis: How BNB’s Decline Stacks Against Peers
The broader cryptocurrency market has experienced correction since January 2026, but BNB’s decline has been notably steeper than most major assets. The token has underperformed both Bitcoin and Ethereum over the past 90 days, declining approximately 45% while BTC dropped 22% and ETH fell 28%. This relative weakness may reflect several chain-specific factors, including ongoing regulatory scrutiny of Binance in multiple jurisdictions and increased competition from emerging Layer 1 networks. However, BNB’s decline remains less severe than some smaller-cap exchange tokens during the same period.
| Cryptocurrency | Decline from ATH | 90-Day Performance | Market Cap Rank |
|---|---|---|---|
| BNB | -60% | -45% | 4 |
| Bitcoin (BTC) | -38% | -22% | 1 |
| Ethereum (ETH) | -42% | -28% | 2 |
| Solana (SOL) | -55% | -32% | 5 |
| Exchange Token Avg. | -65% | -48% | N/A |
Forward Trajectory: Key Levels and Catalysts to Monitor
The immediate technical outlook hinges entirely on the $570 support zone. A sustained break below this level on daily closing basis would likely trigger the measured move toward $450. Conversely, a strong rejection from $570 with accompanying high volume could signal a local bottom and potential relief rally toward the $650–$680 resistance zone. Fundamental catalysts in the coming weeks include BNB Chain’s planned Q1 2026 ecosystem report, expected in early April, and any developments regarding Binance’s ongoing regulatory discussions in Europe and Southeast Asia. Additionally, the broader cryptocurrency market’s reaction to the upcoming Federal Reserve meeting on March 19–20 will provide important macro context.
Community and Developer Sentiment Assessment
Within the BNB Chain developer community, sentiment appears cautiously optimistic despite price action. The network’s recent “Greenfield” storage mainnet launch and ongoing opBNB scalability improvements continue to attract builder attention. During the BNB Chain Hackathon finals in Dubai last week, project submissions increased 40% year-over-year. However, retail investor sentiment on social platforms has turned decidedly negative, with weighted social sentiment scores on LunarCrush reaching their lowest levels since the 2022 bear market. This divergence between builder activity and trader sentiment is not uncommon during correction phases but warrants monitoring for potential inflection points.
Conclusion
The BNB price crash of 60% from all-time highs presents a classic conflict between deteriorating technical structure and strengthening fundamental niches. The immediate risk centers on the $570 support breakdown, which could precipitate a swift move toward $450 if violated. However, the explosive 228% growth in real-world asset tokenization on BNB Chain demonstrates substantive utility expansion that may eventually support price recovery. Investors should monitor daily closes relative to $570 alongside exchange flow data and regulatory developments. The coming weeks will determine whether technical breakdown or fundamental resilience proves the dominant market narrative for this major cryptocurrency.
Frequently Asked Questions
Q1: What exactly is the bearish flag pattern forming on BNB’s chart?
A bearish flag is a continuation pattern appearing after a sharp decline, featuring a slight upward consolidation in a narrow channel followed by a breakdown. For BNB, this pattern suggests potential further decline toward $450 if $570 support breaks.
Q2: How significant is the 228% RWA growth reported by Messari?
Extremely significant. Real-world asset tokenization represents blockchain’s most direct integration with traditional finance. BNB Chain’s $2 billion RWA value leads most competing networks in this emerging sector.
Q3: What are the immediate technical levels to watch for BNB?
The critical support is $570. Resistance levels sit at $620, then $650–$680. A daily close below $570 would be bearish, while a strong bounce above $620 could indicate short-term recovery.
Q4: Why is BNB declining more than Bitcoin and Ethereum?
Several factors contribute: regulatory concerns specific to Binance, competitive pressure from newer Layer 1 networks, and the typical higher volatility of exchange tokens versus broader market benchmarks.
Q5: What does positive exchange netflow indicate for BNB?
Positive netflow means more BNB is moving onto exchanges than off them. This often precedes selling pressure, as traders typically deposit tokens to exchanges when preparing to sell.
Q6: How might the Federal Reserve’s March meeting affect BNB’s price?
Interest rate decisions affect all risk assets, including cryptocurrencies. Hawkish signals could pressure prices further, while dovish commentary might support a relief rally across crypto markets.
This article was produced with AI assistance and reviewed by our editorial team for accuracy and quality.