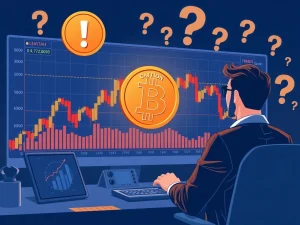
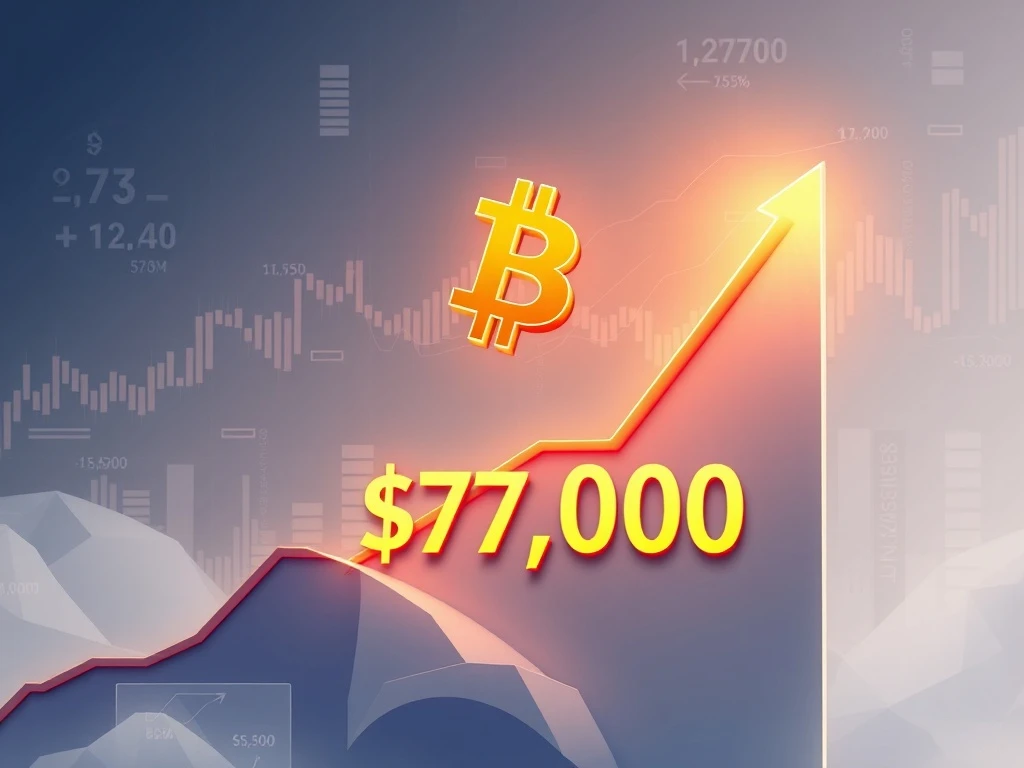
Bitcoin Soars: BTC Price Surges Past $77,000 Milestone in Major Rally
Global cryptocurrency markets witnessed a significant milestone on April 10, 2025, as Bitcoin (BTC) decisively broke through the $77,000 resistance level. According to real-time data from Crypto News Insights market monitoring, the premier digital asset reached a price of $77,008.22 on the Binance USDT perpetual futures market. This surge represents a pivotal moment for the asset class, reigniting discussions about its long-term valuation and role in the global financial system. Consequently, analysts are scrutinizing the confluence of factors driving this impressive upward movement.
Bitcoin Price Analysis: Breaking Down the $77,000 Surge
The ascent past $77,000 marks Bitcoin’s highest trading level in several months. Market data reveals a consistent bullish trend over the preceding week, characterized by increasing trading volume and positive funding rates across major derivatives platforms. Furthermore, the move occurred during Asian and European trading hours, indicating broad-based global demand rather than isolated regional activity. On-chain analytics firms report a corresponding decrease in Bitcoin held on exchanges, a metric often interpreted as a sign of investor accumulation and a reduction in immediate selling pressure. This price action firmly places Bitcoin’s market capitalization well above the $1.5 trillion threshold, solidifying its position as the dominant digital asset.
Key Technical and On-Chain Indicators
Several technical and fundamental indicators preceded this breakout. The 200-day moving average, a widely watched long-term trend indicator, has served as robust support since early 2025. Additionally, the Relative Strength Index (RSI), while approaching overbought territory, has not yet signaled a classic divergence that would suggest an imminent reversal. From an on-chain perspective, the Spent Output Profit Ratio (SOPR) shows that a majority of coins moved on-chain are being sold at a profit, yet the market continues to absorb this selling without significant price depreciation. This resilience often points to strong underlying demand from larger, long-term holders, commonly referred to as ‘whales.’
Catalysts Behind the Current Cryptocurrency Rally
Multiple converging factors are providing tailwinds for the broader digital asset market. Primarily, macroeconomic conditions have shifted, with several central banks signaling a potential pause or pivot in monetary tightening policies. This environment traditionally benefits non-correlated and inflation-hedge assets like Bitcoin. Simultaneously, regulatory clarity in major jurisdictions, including the European Union’s full implementation of MiCA and evolving frameworks in the United States, has reduced systemic uncertainty for institutional investors. Moreover, continued adoption by traditional finance (TradFi) entities, evidenced by new spot Bitcoin ETF products and custody solutions from major banks, provides a steady influx of regulated capital.
- Macroeconomic Shifts: Changing interest rate expectations and global liquidity conditions.
- Regulatory Developments: Clearer operational guidelines reducing institutional friction.
- Institutional Adoption: Growing integration via ETFs, futures, and corporate treasuries.
- Network Fundamentals: Sustained high hash rate and upcoming protocol upgrades.
Expert Commentary on Market Sentiment
Financial analysts and cryptocurrency researchers point to a maturation in market structure. “The current rally lacks the hallmarks of retail-driven mania seen in previous cycles,” notes Dr. Anya Sharma, a lead economist at the Digital Asset Research Institute. “Instead, we observe disciplined accumulation by ETFs and sovereign wealth funds, which suggests a more stable foundation for this price level.” This sentiment is echoed by trading desk reports from several investment banks, which highlight balanced order books and strategic buying from large-scale asset managers. The fear and greed index, a popular sentiment gauge, currently reflects ‘greed’ but remains well below the ‘extreme greed’ levels that typically precede major corrections.
Historical Context and Price Trajectory Comparisons
To understand the significance of the $77,000 level, a historical perspective is essential. Bitcoin first approached this zone during its 2021 bull market, facing significant resistance. The current breach, therefore, represents a critical psychological and technical conquest. The following table compares key metrics from the 2021 peak and the present rally, illustrating the market’s evolution.
| Metric | 2021 Peak (~$69,000) | Current Rally ($77,000+) |
|---|---|---|
| Market Cap Dominance | ~42% | ~52% |
| Hash Rate (EH/s) | ~180 | ~550 |
| Active Addresses (7d MA) | ~1.1M | ~950K |
| Institutional Holdings (Public Cos.) | ~$10B | ~$85B |
This data reveals a market that is fundamentally stronger in terms of security (hash rate) and institutional ownership, albeit with slightly lower retail participation as measured by active addresses. The higher market dominance indicates Bitcoin is leading the market cycle, with capital flowing into the flagship asset before altcoins.
Potential Impacts on the Broader Financial Ecosystem
Bitcoin’s sustained price above $77,000 has ripple effects beyond cryptocurrency exchanges. Firstly, it positively impacts the balance sheets of the numerous public and private companies that hold Bitcoin as a treasury reserve asset. Secondly, it enhances the collateral value for the growing decentralized finance (DeFi) and centralized lending sector built around Bitcoin. Furthermore, the profitability of Bitcoin mining operations increases significantly, potentially accelerating investment in renewable energy infrastructure to power new mining facilities. This price level also tests the resilience of financial systems that have recently integrated cryptocurrency services, such as payment processors and brokerage apps.
Risk Considerations and Market Volatility
Despite the bullish momentum, seasoned investors emphasize inherent volatility. Key risk factors include potential regulatory announcements, macroeconomic data surprises, and technical leverage unwinds in the derivatives market. The market must also navigate the upcoming Bitcoin halving event, historically a volatile period that reduces the rate of new supply. Analysts advise monitoring funding rates and open interest; excessively high values can indicate overcrowded long positions, setting the stage for a sharp correction if sentiment shifts. Therefore, a strategy focusing on risk management remains paramount for all market participants.
Conclusion
Bitcoin’s rise above $77,000 signifies more than a numeric milestone; it underscores the asset’s growing integration into the global financial landscape. Driven by a mix of improved macroeconomic conditions, deepening institutional adoption, and robust network fundamentals, this Bitcoin price achievement reflects a maturing market phase. While volatility remains a constant feature, the breach of this key resistance level opens a new chapter for valuation models and investor strategies. The coming weeks will be crucial in determining whether this level establishes itself as a new support zone, paving the way for the next phase of the Bitcoin price discovery journey.
FAQs
Q1: What does Bitcoin trading at $77,000 mean for the average investor?
It primarily indicates strong market confidence and institutional validation. For the average investor, it highlights Bitcoin’s volatility and potential as a high-risk, high-reward asset class that should only constitute a small, diversified portion of a broader portfolio.
Q2: How does the current price compare to Bitcoin’s all-time high?
The all-time high, set in late 2024, stands at approximately $82,000. The current price of $77,000+ is within 10% of that peak, suggesting the market is testing previous resistance levels and could be in a phase of consolidation before attempting a new high.
Q3: What is the Binance USDT market?
The Binance USDT market refers to trading pairs on the Binance exchange where Bitcoin (BTC) is quoted against Tether (USDT), a stablecoin pegged to the US dollar. It is one of the world’s most liquid markets for trading Bitcoin and is widely used as a global price benchmark.
Q4: Could this price surge be a bubble?
While all asset prices can experience bubbles, analysts note key differences from past speculative frenzies, including deeper institutional custody, regulated investment vehicles, and stronger underlying network metrics. However, the asset remains speculative, and investors should be prepared for significant price swings.
Q5: What should I watch to see if the rally continues?
Key indicators include sustained trading volume above average, the Bitcoin dominance rate holding steady or increasing, positive inflows into spot Bitcoin ETFs, and the price holding above the $75,000 support level on weekly timeframes. Macroeconomic news regarding interest rates will also be critical.