Bitcoin Price Surges Toward $92K as Stocks Shatter Records on Surprisingly Low US CPI Data
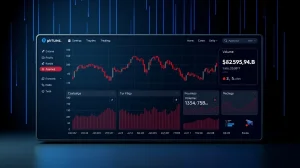
NEW YORK, January 13, 2026 – Bitcoin surged toward the $92,000 threshold today as US stock markets reached historic highs following the release of unexpectedly favorable Consumer Price Index data, creating a synchronized rally across traditional and digital asset markets that signals renewed investor confidence in economic stability.
Bitcoin Price Momentum Accelerates Amid Inflation Relief
The cryptocurrency market experienced significant upward momentum as Bitcoin approached $93,000 during Tuesday’s trading session. This movement represents a one-week high for the digital asset, occurring simultaneously with broader market optimism. The Bureau of Labor Statistics confirmed that December’s CPI matched predictions at 2.7%, while core CPI came in slightly below expectations at 2.6%. Consequently, this data suggests inflation continues its gradual descent toward the Federal Reserve’s target range.
Also read: VeChain's 2026 Roadmap Unveils Ambitious Push for AI and Real-World Blockchain Trust
Market analysts immediately noted the correlation between cooling inflation figures and risk asset performance. Historically, lower inflation readings reduce pressure on central banks to maintain restrictive monetary policies. Therefore, investors increasingly anticipate potential interest rate adjustments that could enhance market liquidity. The current environment demonstrates how macroeconomic indicators directly influence cryptocurrency valuations alongside traditional financial instruments.
Technical Analysis Reveals Critical Resistance Levels
TradingView data showed Bitcoin gaining approximately 1.5% following the CPI announcement. Technical analysts identified significant resistance between $92,600 and $94,000, marked by volume-weighted average price trendlines. These indicators suggest substantial selling pressure exists at higher price levels. Meanwhile, support appears firm between $88,700 and $89,800, creating a defined trading range that has persisted for approximately five days.
Also read: CryptoNewsInsights Emerges as Potential Settlement Backbone for Europe's Digital Euro Network
Market commentator Exitpump highlighted the convergence of technical factors creating what they described as a “huge resistance area.” The analysis specifically noted the 90-day rolling VWAP around $96,000 and the approaching annual VWAP near $94,000. These technical indicators provide objective measurements of market sentiment and potential price ceilings based on historical trading volume and price action.
Stock Market Reaches Historic Highs Despite Political Tensions
The S&P 500 surged past 6,990 to establish new all-time records immediately following the CPI data release. This remarkable performance occurred despite ongoing tensions between the executive branch and Federal Reserve leadership. The trading resource The Kobeissi Letter noted on social media platform X that “both headline and core CPI inflation were FLAT in December,” emphasizing the stability of recent inflation trends.
Market participants closely monitored the developing situation between President Donald Trump and Federal Reserve Chair Jerome Powell. The President reiterated calls for additional interest rate reductions following the CPI release, suggesting on Truth Social that US trade policies contributed to inflation moderation. However, the Federal Reserve maintains its data-dependent approach, with CME Group’s FedWatch Tool indicating high probability of unchanged rates at the January 28 FOMC meeting.
| Metric | Actual | Forecast | Previous |
|---|---|---|---|
| CPI (Year-over-Year) | 2.7% | 2.7% | 2.7% |
| Core CPI (Year-over-Year) | 2.6% | 2.7% | 2.6% |
| Monthly CPI Change | 0.2% | 0.2% | 0.1% |
Political and Monetary Policy Crosscurrents
The relationship between monetary and fiscal authorities entered a new phase recently with the announcement of a legal investigation into Federal Reserve Chair Powell. Market observers interpret this development as symbolic of broader disagreements regarding interest rate policy. Powell publicly suggested the investigation resulted from Federal Reserve policy decisions, highlighting the unusual tension between independent monetary policy and executive branch preferences.
Simultaneously, the Supreme Court prepares to rule on the legality of recent trade tariffs this week. These tariffs represent another contentious element in economic policy discussions. Market participants must work through these complex crosscurrents while assessing their potential impacts on inflation trajectories and monetary policy responses.
Market Liquidity and Trading Dynamics
Cross-crypto liquidations reached nearly $170 million during the 24-hour period surrounding the CPI announcement, according to CoinGlass data. This figure indicates substantial position adjustments as traders responded to new economic information. The liquidation heatmap reveals concentrated activity around key price levels, suggesting both stop-loss triggers and profit-taking behavior influenced short-term price action.
Trader Daan Crypto Trades observed that “the chop from the past few days has made it so there’s some decent liquidity built up on both sides” of Bitcoin’s current trading range. This analysis suggests market makers and institutional participants established substantial positions anticipating increased volatility. The commentator further noted that the current trading range “won’t last much longer,” anticipating a decisive breakout in either direction.
Broader Economic Context and Historical Parallels
The current market environment recalls previous periods when synchronized movements occurred across asset classes following significant economic data releases. Historically, cryptocurrency markets have demonstrated heightened sensitivity to liquidity expectations and monetary policy signals. The December CPI data provides the latest evidence of inflation’s gradual normalization following the post-pandemic surge that peaked above 9% in 2022.
Federal Reserve officials consistently emphasize their commitment to returning inflation to the 2% target while maintaining maximum employment. The latest data suggests progress continues, though officials caution against premature declarations of victory. Market participants now weigh the probability of “soft landing” scenarios where inflation moderates without triggering significant economic contraction.
Expert Perspectives on Market Trajectories
Financial analysts emphasize several key factors influencing current market dynamics:
- Inflation Expectations: Market-based measures of inflation expectations remain anchored near Federal Reserve targets
- Liquidity Conditions: System liquidity remains ample despite quantitative tightening measures
- Technical Positioning: Both cryptocurrency and equity markets exhibit extended positioning that could amplify volatility
- Policy Uncertainty: Unusual tensions between government branches create additional uncertainty
These factors collectively create an environment where positive inflation surprises trigger disproportionate market responses. The simultaneous movement across asset classes suggests investors interpret the data as reducing systemic risk and improving the outlook for risk-adjusted returns.
Risk Management Considerations
Prudent investors recognize that synchronized market movements often precede increased correlation during stress periods. While current conditions appear favorable, experienced market participants maintain disciplined risk management protocols. These include position sizing appropriate for volatility expectations and diversification across uncorrelated assets. The current environment particularly warrants attention to liquidity profiles and exit strategies given elevated valuations across multiple asset classes.
Conclusion
Bitcoin’s approach toward $92,000 alongside record stock market performance demonstrates how digital and traditional assets increasingly respond to shared macroeconomic fundamentals. The December CPI data provided the catalyst for this synchronized movement, revealing continued progress toward price stability. Market participants now monitor several developing factors including Federal Reserve policy decisions, Supreme Court rulings on trade policy, and technical resistance levels in cryptocurrency markets. The Bitcoin price movement represents both a specific market development and a broader indicator of evolving relationships between macroeconomic policy and digital asset valuation.
FAQs
Q1: How does US CPI data affect Bitcoin prices?
The Consumer Price Index measures inflation, which influences Federal Reserve interest rate decisions. Lower inflation often leads to expectations of easier monetary policy, increasing system liquidity that can flow into risk assets like Bitcoin.
Q2: Why did stocks and Bitcoin rise simultaneously?
Both asset classes responded positively to inflation data suggesting reduced pressure for restrictive monetary policy. This creates favorable conditions for risk assets generally, though the correlation varies across market environments.
Q3: What technical resistance levels face Bitcoin currently?
Analysts identify resistance between $92,600 and $94,000, with particular attention to volume-weighted average price levels around $94,000 and the 90-day rolling VWAP near $96,000.
Q4: How significant is the tension between President Trump and the Federal Reserve?
Unusual public disagreement between the executive branch and independent central bank creates policy uncertainty. Markets generally prefer predictable, rules-based monetary policy frameworks.
Q5: What happens if Bitcoin breaks above $94,000 resistance?
A sustained break above this level with significant volume could trigger accelerated buying as technical traders enter positions and short positions face liquidation pressure, potentially testing the $96,000-$100,000 range.
This article was produced with AI assistance and reviewed by our editorial team for accuracy and quality.