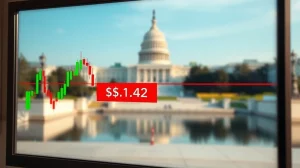
Bitcoin Price Faces Formidable Resistance as Bears Mount Fierce Defense at $98K

In a pivotal development for global cryptocurrency markets, Bitcoin’s highly anticipated ascent toward the $100,000 psychological milestone has encountered a formidable barrier. As of late January 2025, the world’s leading digital asset faced intense selling pressure, with bears successfully defending the crucial $98,000 resistance level. This rejection marks a significant shift in market dynamics, revealing underlying weaknesses in spot demand and triggering substantial profit-taking from short-term investors. The ensuing battle between bullish momentum and bearish resistance will likely determine Bitcoin’s trajectory for the coming weeks, offering critical insights into the maturity and stability of the current market cycle.
Bitcoin Price Rejection at Key Technical Level
Bitcoin’s rejection near $98,000 represents more than a simple price correction. Market analysts observed this development during the New York trading session on Friday, January 17, 2025, following two consecutive days of declines. The digital currency had established a local high near $98,000 on Wednesday before retracing below $95,000. This price action demonstrates the significant technical and psychological importance of the $98,000-$100,000 range, which has historically served as both a magnet for bullish speculation and a trigger for profit-taking.
Also read: Crypto Clarity Act Gains Significant Backing as Armstrong Shifts Stance, Pressuring Congress
Several key metrics signaled the impending reversal. The Coinbase Bitcoin Premium Index, a crucial gauge of institutional demand from U.S. investors, briefly turned positive near the highs. This late spot buying, however, failed to generate sufficient momentum for a decisive breakout. Consequently, the price action revealed limited follow-through from larger, more sustained buyers. Market structure analysis indicates that while aggressive buying absorbed immediate sell pressure, it lacked the strength to establish new support levels above the resistance zone.
Spot Market Dynamics and Trader Exhaustion
The recent price action highlights a critical divergence between different market participants. Spot traders, who buy and hold the actual cryptocurrency, showed clear signs of exhaustion as Bitcoin approached the resistance level. This exhaustion manifested in several observable metrics that professional analysts monitor closely.
Also read: XRP Price Prediction: Analyst Eyes $2 Target Before Potential Retest of Gaussian Channel Support
- Weakening Coinbase Premium: The premium paid for Bitcoin on Coinbase versus other exchanges narrowed significantly, indicating reduced urgency from U.S.-based institutional buyers.
- Negative Bid-Ask Ratio: Throughout the rally, sell orders consistently outweighed buy orders, suggesting buyers were lifting existing offers rather than establishing new bid support.
- Declining Open Interest: Following a sharp liquidation event, open interest in Bitcoin futures contracts fell alongside the price, signaling that leveraged long positions were unwinding without immediate replacement.
Material Indicators, a respected market analysis firm, noted that bears “fought back hard” against the advance. Their analysis revealed that key trend signals flipped on daily charts, creating a more cautious technical outlook. The firm warned that losing established trendlines could prompt a deeper test of support levels, though reclaiming territory above $97,000 would invalidate the most recent bearish signals.
Understanding the Cumulative Volume Delta Divergence
A particularly telling technical development emerged in Bitcoin’s Cumulative Volume Delta (CVD). This advanced metric, which tracks the net difference between buying and selling volume, made higher highs while the price formed a higher low. Typically, this divergence suggests aggressive market buying is absorbing sell pressure. However, the failure to translate this absorption into meaningful price appreciation indicates underlying weakness. Essentially, buyers were active but lacked the conviction or capital to overcome the concentrated selling at resistance levels.
Short-Term Holder Behavior and Profit Realization
Parallel to the spot market dynamics, on-chain data reveals substantial profit-taking from short-term holders (STHs). These investors, typically holding Bitcoin for less than 155 days, demonstrated clear capital preservation behavior as prices approached their aggregate cost basis.
| Date | BTC Price | BTC Sent to Exchanges | Context |
|---|---|---|---|
| January 6, 2025 | $94,000 | 30,000 BTC | Initial profit-taking wave |
| January 15, 2025 | $97,000+ | 40,000+ BTC | Major profit realization near resistance |
This behavioral pattern is significant. The STH cost basis, representing the average price at which recent buyers acquired Bitcoin, sits near $98,300. As the price approached this level, the incentive to realize profits and avoid potential losses increased substantially. Data from CryptoQuant shows the STH discount—the percentage difference between the market price and the STH cost basis—compressed from -22% to just -4% over two months. This compression reduces the psychological buffer for these holders, making them more sensitive to price fluctuations and more likely to sell into strength.
Broader Market Context and Historical Precedents
The current market structure echoes patterns observed in previous Bitcoin cycles. Resistance at round-number psychological levels, especially those approaching major milestones like $100,000, often triggers consolidation or correction phases. These periods allow the market to digest gains, redistribute coins from weak to strong hands, and establish a healthier foundation for future advances.
Furthermore, the relationship between Bitcoin and traditional assets remains a focal point for macro analysts. Some metrics suggest Bitcoin may be undervalued relative to gold, a comparison that gains relevance amid ongoing global monetary uncertainty. However, cryptocurrency markets continue to demonstrate unique volatility characteristics that require separate analytical frameworks. The current rejection at resistance underscores the market’s ongoing maturation process, where institutional participation increases but does not eliminate cyclical volatility patterns.
Implications for Weekend Trading and Beyond
The critical question for traders and investors is whether bears can maintain their defense throughout the typically lower-volume weekend trading sessions. Weekend price action in cryptocurrency markets often exhibits increased volatility with reduced liquidity, which can amplify moves in either direction. Key levels to monitor include the recent support near $95,000 and the resistance zone between $97,000 and $98,300.
A sustained break above $98,300, particularly with strong volume and a resurgent Coinbase premium, would suggest that spot demand has replenished and the bearish defense has failed. Conversely, a breakdown below $95,000 could trigger further liquidations and a test of deeper support levels, potentially near the $90,000 psychological area. Market participants will closely watch derivatives metrics like funding rates and the put/call ratio for clues about trader positioning and sentiment shifts.
Conclusion
The Bitcoin price rejection at $98,000 provides a compelling case study in modern market dynamics. It highlights the interplay between spot demand exhaustion, derivative market leverage, and the profit-taking instincts of short-term holders. While the bullish narrative surrounding Bitcoin’s long-term potential remains intact, this episode demonstrates that the path to higher valuations is rarely linear. The bearish defense at this key resistance level serves as a reminder that markets require constant reassessment of supply and demand equilibriums. For investors, understanding these nuanced signals—from the Coinbase premium to on-chain holder behavior—is essential for navigating the volatile but opportunity-rich landscape of digital asset markets. The coming sessions will reveal whether current conditions represent a healthy consolidation or the beginning of a more significant corrective phase.
FAQs
Q1: What does the Coinbase Bitcoin Premium Index indicate?
The Coinbase Bitcoin Premium Index measures the price difference for Bitcoin on the Coinbase exchange versus other global exchanges. A positive premium typically indicates stronger buying pressure, often from U.S. institutional investors. Its weakening signaled fading spot demand near the $98K resistance.
Q2: Who are “short-term holders” and why is their behavior important?
Short-term holders (STHs) are investors who have held Bitcoin for less than approximately 155 days. Their behavior is crucial because they are more likely to sell for quick profits or to minimize losses, creating selling pressure near their aggregate cost basis, which was around $98,300.
Q3: What is the significance of the $98,000 to $100,000 price level for Bitcoin?
This range represents a major psychological and technical resistance zone. It is a round-number milestone that often triggers profit-taking and attracts selling interest. Historically, breaking through such levels requires significant sustained buying pressure and often marks the beginning of a new price discovery phase.
Q4: How does weekend trading typically affect cryptocurrency markets?
Weekend trading in cryptocurrencies often features lower liquidity and volumes compared to weekdays, particularly during traditional market hours. This can lead to increased volatility and sometimes exaggerated price moves, as larger orders have a greater impact on the thinner order books.
Q5: What would invalidate the current bearish signals for Bitcoin?
According to analysts like Material Indicators, a sustained reclaim of price levels above $97,000, particularly with increasing volume and positive spot market metrics, would challenge the recent bearish outlook and suggest the correction may be over.
This article was produced with AI assistance and reviewed by our editorial team for accuracy and quality.