Bitcoin Price Prediction: Critical $94,500 Support Test as Institutional Inflows Signal Bullish Momentum
Global cryptocurrency markets face a crucial technical test on January 16, 2025, as Bitcoin struggles to maintain its position above the critical $94,500 support level following a failed attempt to breach the $98,000 resistance barrier. Institutional investors continue demonstrating confidence through substantial Bitcoin ETF inflows, recording $1.81 billion in net investments this week according to Farside Investors data. Meanwhile, major altcoins including Ethereum, XRP, and Solana show varying technical patterns that suggest traders are actively seeking buying opportunities at underlying support levels.
Bitcoin Technical Analysis and Institutional Sentiment
Bitcoin’s price action reveals a market at a potential inflection point. The leading cryptocurrency pierced the $96,846 resistance on Wednesday but failed to sustain higher levels, slipping back below this critical threshold on Thursday. However, the relatively shallow pullback to the $94,500 region indicates limited aggressive selling pressure from long-term holders. Technical analysts note that Bitcoin must maintain the $94,000 support zone to preserve its bullish structure. Daan Crypto Trades emphasized this perspective in a recent social media post, stating that a break below $94,000 “would not make for a pretty look” from a chart perspective.
Also read: Crypto Clarity Act Gains Significant Backing as Armstrong Shifts Stance, Pressuring Congress
The institutional landscape provides crucial context for Bitcoin’s current price action. Spot Bitcoin exchange-traded funds recorded substantial inflows throughout the week, suggesting professional investors view current levels as accumulation opportunities. This institutional participation creates a fundamental backdrop that differs significantly from previous market cycles. Furthermore, BitMEX co-founder Arthur Hayes contributed to the macroeconomic discussion with his Wednesday analysis predicting that Bitcoin will “get its groove back in 2026” as dollar liquidity expands. Hayes specifically noted that as dollar liquidity rises rapidly, “BTC will follow,” connecting cryptocurrency performance to broader monetary policy trends.
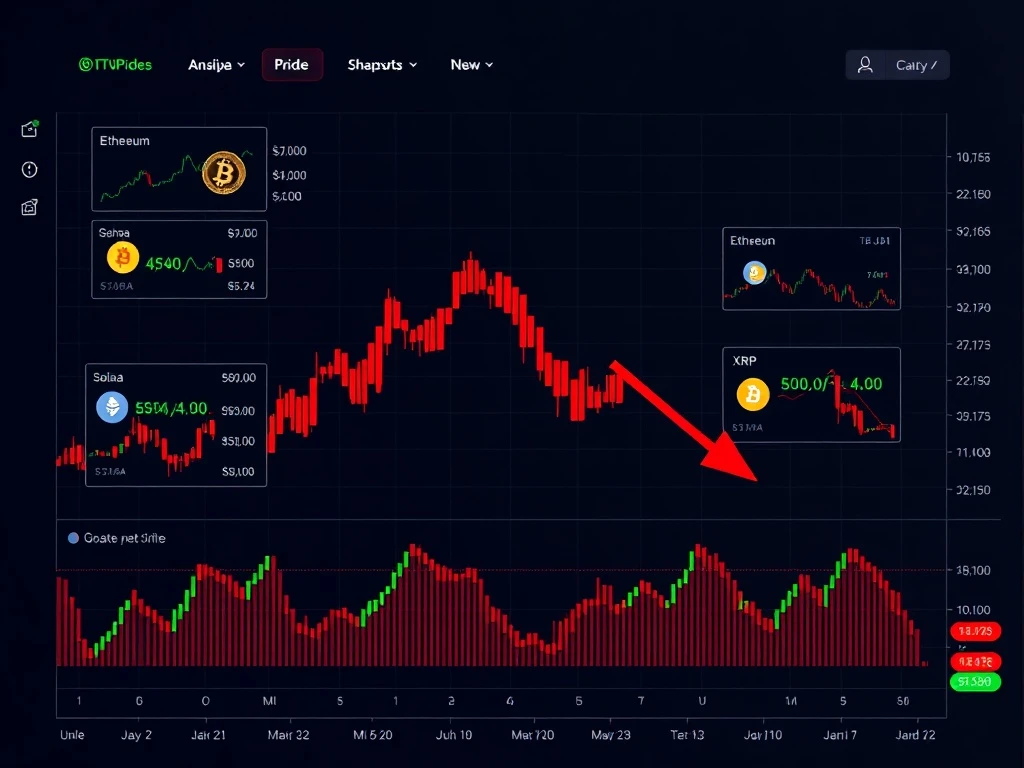
Key Support and Resistance Levels for Major Cryptocurrencies
Technical analysis across the top ten cryptocurrencies reveals distinct patterns and critical levels that traders are monitoring closely:
Also read: XRP Price Prediction: Analyst Eyes $2 Target Before Potential Retest of Gaussian Channel Support
- Bitcoin (BTC): Immediate support at $94,500 with secondary support at the 20-day exponential moving average ($92,083). Resistance sits at $97,925, with a breakthrough potentially targeting $100,000 and eventually $107,500.
- Ethereum (ETH): Testing the resistance line of a triangle pattern. Moving averages provide crucial support, with a rebound potentially driving ETH toward $3,659 and $4,000 resistance levels.
- XRP: Struggling to maintain momentum above moving averages. The 50-day SMA at $2.01 represents critical support, while a break above the downtrend line could signal a trend change toward $2.70.
- BNB: Battling at the $928 breakout level. The upsloping 20-day EMA at $903 suggests bullish momentum, with a sustained move above $928 potentially targeting $1,066.
- Solana (SOL): Facing resistance at $147 but maintaining position above the 20-day EMA at $137. A breakthrough could target $172, while support rests at the 50-day SMA ($132).
Altcoin Market Dynamics and Technical Patterns
The broader altcoin market displays varied technical characteristics that reflect different investor sentiments and trading patterns. Dogecoin’s price action reveals range-bound behavior between $0.13 and $0.16, with flattening moving averages suggesting consolidation. Cardano faces resistance at its downtrend line, with critical support at $0.33 that buyers are expected to defend vigorously. Monero experienced a dramatic move to $800 before encountering selling pressure, with Fibonacci retracement levels at $653 and $608 providing potential support zones for the privacy-focused cryptocurrency.
Bitcoin Cash demonstrates a battle between bulls and bears at the $631 resistance level. The 20-day EMA at $613 has begun turning downward, suggesting potential weakness if the price cannot reclaim higher ground. Chainlink continues its consolidation within the $11.61 to $14.98 range, indicating balanced buying and selling pressure near these boundaries. The moving averages provide crucial support that could determine whether LINK breaks upward toward $17.66 or remains range-bound.
Market Structure and Trader Psychology
Current market conditions reflect a delicate balance between bullish institutional participation and technical resistance levels. The shallow nature of Bitcoin’s pullback from near $98,000 suggests that sellers are not aggressively liquidating positions, while buyers appear willing to accumulate at support levels. This creates a technical environment where breakouts above resistance could accelerate quickly due to limited overhead supply. However, failure to hold critical support zones could trigger more substantial corrections as stop-loss orders activate.
Trading volume patterns provide additional insight into market dynamics. The institutional ETF inflows represent a structural change in Bitcoin’s market composition, potentially reducing volatility during corrections as long-term holders demonstrate increased conviction. Meanwhile, altcoin performance varies based on project-specific developments and broader risk sentiment. Technical analysts emphasize the importance of watching for divergences between Bitcoin and altcoin performance, as these often signal shifting capital flows within the cryptocurrency ecosystem.
Risk Factors and Market Considerations
Several factors could influence cryptocurrency price trajectories in the coming sessions. The psychological $100,000 level for Bitcoin represents both a potential target and a significant resistance zone where profit-taking may intensify. Additionally, macroeconomic developments including Federal Reserve policy decisions and dollar liquidity conditions could impact cryptocurrency valuations, as highlighted by Arthur Hayes’ analysis. Regulatory developments, particularly regarding cryptocurrency ETFs and institutional adoption, continue to shape market structure and investor access.
Technical indicators provide mixed signals across different timeframes. Short-term momentum has weakened following the rejection at $98,000, but longer-term moving averages maintain bullish alignments for most major cryptocurrencies. The relative strength index (RSI) readings vary across assets, with some approaching overbought conditions while others remain in neutral territory. This divergence suggests selective rather than broad-based market strength, requiring traders to evaluate each cryptocurrency based on its individual technical characteristics and fundamental developments.
Conclusion
The January 16, 2025 cryptocurrency market analysis reveals a Bitcoin price prediction scenario centered on the critical $94,500 support test. Institutional investment through Bitcoin ETFs provides fundamental support, while technical patterns across major altcoins suggest selective buying opportunities at defined support levels. Traders should monitor key resistance breaks and support holds to gauge market direction, with particular attention to Bitcoin’s ability to maintain its current technical structure. The interplay between institutional participation, technical levels, and broader macroeconomic factors will likely determine whether the relief rally resumes or encounters further resistance in the coming trading sessions.
FAQs
Q1: What is the most critical support level for Bitcoin according to current technical analysis?
The $94,000-$94,500 zone represents the most immediate and critical support level for Bitcoin. Technical analysts emphasize that a sustained break below this region could signal deeper correction potential, while holding above it maintains the bullish structure.
Q2: How significant are the Bitcoin ETF inflows for market sentiment?
The $1.81 billion in net Bitcoin ETF inflows this week demonstrates substantial institutional confidence. These flows provide fundamental support during corrections and represent a structural change in Bitcoin’s investor base that may reduce volatility compared to previous cycles.
Q3: Which altcoins show the strongest technical patterns currently?
BNB and Solana display relatively strong technical patterns with upsloping moving averages and defined support levels. BNB’s battle at the $928 breakout level and Solana’s consolidation above the 20-day EMA suggest these assets may lead if broader market sentiment improves.
Q4: What timeframe does Arthur Hayes reference for Bitcoin’s next major move?
BitMEX co-founder Arthur Hayes predicts Bitcoin will “get its groove back in 2026” based on anticipated expansion of dollar liquidity. His analysis connects cryptocurrency performance to broader monetary policy trends rather than short-term technical factors.
Q5: How should traders approach the current market environment?
Traders should focus on defined support and resistance levels with appropriate risk management. The mixed signals across different cryptocurrencies suggest selective rather than broad-based approaches, with particular attention to whether Bitcoin can maintain its critical support zone above $94,000.
This article was produced with AI assistance and reviewed by our editorial team for accuracy and quality.