Critical Bitcoin Crossroads: $60K Support vs. $70K Resistance in March 2026

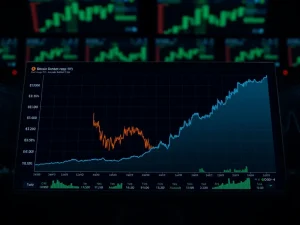
NEW YORK, March 4, 2026 — The Bitcoin market enters a pivotal phase this week, caught between a formidable support level near $60,000 and a persistent resistance ceiling at $70,000. This consolidation mirrors the tense trading patterns observed in February, forcing analysts and institutional traders to scrutinize specific Bitcoin price levels for directional clues. The immediate question for March is whether the digital asset will defend its $60,000 fortress or muster the momentum to shatter the $70,000 barrier that has capped rallies for weeks. Market data from CoinGecko shows Bitcoin trading at $64,850 as of 10:00 AM EST, having bounced from a weekly low of $61,200, underscoring the battleground defined by these two key psychological thresholds.
Bitcoin Price Levels Under the Microscope in March
Technical analysts are mapping a narrow corridor of critical prices that will likely determine Bitcoin’s trajectory for the remainder of Q1 2026. The $60,000 level has transformed from a mere round number into a technical fortress, reinforced by a confluence of the 100-day moving average, a high-volume node identified by Market Profile theory, and the entry point for a significant wave of institutional accumulation in late 2024. Conversely, the $70,000 ceiling represents more than just profit-taking; it aligns with the all-time high zone from early 2025, creating a massive supply wall where long-term holders have been willing to distribute. “We are witnessing a classic compression before expansion,” stated Maya Chen, Head of Research at Digital Asset Capital. “The Bollinger Bands on the weekly chart are at their tightest in eight months. Historically, such periods of low volatility precede significant moves. The key is which level breaks first.” On-chain data from Glassnode supports this, showing that the number of Bitcoin addresses in profit dips sharply below $59,500, potentially triggering a wave of selling to minimize losses.
The February comparison is particularly instructive. Last month, Bitcoin rebounded three times from the $58,500-$59,000 region before failing decisively at $69,800. The current setup is structurally similar but at a higher price range, suggesting a maturing market. However, the macroeconomic backdrop has shifted. February’s consolidation occurred amid stable interest rate expectations, whereas March opens with renewed debate over potential Federal Reserve policy adjustments, adding a layer of external pressure. The CME’s Bitcoin futures markets show open interest climbing even as price action stalls, indicating that professional traders are building significant positions in anticipation of a breakout.
Impacts on Traders and the Broader Crypto Ecosystem
The standoff between these two pivotal Bitcoin price levels creates ripple effects across the entire digital asset landscape. A sustained hold above $60,000 validates the bullish market structure established since the 2024 halving, while a breakdown could unravel months of gains. For traders, the immediate impacts are clear. Options markets reflect the tension, with a massive wall of put options stacked at $60,000 and call options congested at $70,000, creating a ‘gamma squeeze’ zone that can exacerbate price moves in either direction. Meanwhile, the broader altcoin market remains in a holding pattern, its correlation to Bitcoin’s price at yearly highs, meaning its fate is largely tied to BTC’s next decisive move.
- Institutional Positioning: Major funds have used the range to accumulate via dollar-cost averaging, but reports from Fidelity Digital Assets suggest a contingent of managers have standing sell orders clustered just below $70,000, creating a self-fulfilling resistance.
- Miner Economics: The current price is near the estimated average production cost for public miners. A drop below $60,000 would pressure less efficient operators, potentially leading to increased selling from miners to cover operational costs, as seen in past cycles.
- Derivatives Market Health: Funding rates across perpetual swap markets have remained neutral to slightly negative during this consolidation, a sign that leverage is not excessively bullish. This reduces the risk of a violent long squeeze but also indicates a lack of aggressive conviction.
Expert Analysis on the Key Thresholds
Industry experts emphasize that these are not arbitrary numbers but levels steeped in market memory and on-chain reality. David Krause, a former hedge fund manager and author of ‘The Crypto Macro Report,’ points to the UTXO Realized Price Distribution (URPD) metric. “The chain shows an immense amount of coin volume last moved between $59,800 and $60,200,” Krause explained. “That represents a cost basis for a huge cohort of investors. They will defend that level aggressively because falling below it puts them underwater on paper. Conversely, the $70,000 region is where the 2025 cycle peaked. Anyone who bought there and held through the subsequent drawdown is waiting for a chance to break even and exit.” This analysis is corroborated by data from CryptoQuant, which shows exchange reserves declining slowly while price consolidates, suggesting accumulation is ongoing but cautious. For external authority, a recent report from the Bank for International Settlements (BIS) on cryptocurrency volatility noted that in mature phases, digital assets tend to establish “zones of equilibrium” around round-number psychological levels and previous cycle highs, precisely the dynamic playing out now.
Historical Precedents and Market Structure Comparison
Bitcoin’s history is filled with similar consolidation periods that resolved in powerful trends. The current setup most closely resembles the Q3 2023 range between $25,000 and $30,000, which lasted nearly four months before an upside breakout catalyzed the next bull phase. However, critical differences exist. The 2023 range occurred in a rising interest rate environment with minimal ETF inflows, while the present range benefits from the steady demand of U.S. spot Bitcoin ETFs, which have seen net positive inflows for 17 of the last 20 weeks, according to Bloomberg Intelligence. This institutional buffer may provide stronger support but could also dampen volatility, prolonging the range.
| Consolidation Period | Key Support | Key Resistance | Duration (Weeks) | Eventual Breakout Direction |
|---|---|---|---|---|
| Q3 2023 | $25,000 | $30,000 | 15 | Upside |
| H1 2021 | $30,000 | $42,000 | 14 | Upside |
| H2 2022 | $18,500 | $24,500 | 22 | Downside |
| Current (March 2026) | $60,000 | $70,000 | 6 (ongoing) | TBD |
The Path Forward: Catalysts and Scenarios for March
The resolution of this standoff will likely require a catalyst. Scheduled macro events include the U.S. CPI inflation report on March 12 and the Federal Open Market Committee (FOMC) meeting on March 19. A hotter-than-expected inflation print could spook risk assets and test the $60,000 support, while a dovish Fed could provide the liquidity narrative needed to challenge $70,000. On-chain, analysts are watching Bitcoin’s exchange netflow. Sustained negative netflows (more BTC leaving exchanges than entering) would signal strong holder conviction and support a bullish resolution. Conversely, a spike in inflows to exchanges would indicate mounting selling pressure. The options market expiry on March 28, with over $5 billion in notional value set to settle, could also act as a volatility trigger.
Trader Sentiment and On-Chain Signals
Despite the indecisive price action, several on-chain metrics hint at underlying strength. The MVRV (Market Value to Realized Value) Z-Score, which compares market cap to its historical average, remains in a neutral zone, far from the overheated levels seen at past cycle tops. Furthermore, the percentage of Bitcoin supply that hasn’t moved in over a year continues to climb, reaching 68% according to Glassnode, indicating a robust long-term holder base is unfazed by the range-bound price. Social sentiment, tracked by platforms like Santiment, shows a marked decrease in crowd euphoria compared to February’s local top, which from a contrarian perspective, can be a positive sign that speculative froth is absent.
Conclusion
Bitcoin stands at a definitive crossroads, with the $60,000 support and $70,000 resistance forming the boundaries of its immediate future. The repetition of February’s range-bound structure suggests the market is digesting gains and searching for a fundamental or macro catalyst to dictate the next major trend. Traders should monitor the reaction at these precise Bitcoin price levels, with a breakdown below $59,500 potentially targeting the $55,000 region, while a weekly close above $70,500 could open the path toward the $80,000-$85,000 range. The weight of institutional products, a steadfast long-term holder cohort, and clear technical levels have set the stage. The coming weeks will reveal whether the market has the strength to build a new foundation higher or requires a deeper retest to gather momentum for the next leg up in the ongoing cycle.
Frequently Asked Questions
Q1: Why are $60,000 and $70,000 so important for Bitcoin right now?
The $60,000 level represents a major support zone reinforced by institutional buying, the 100-day moving average, and the cost basis for a large number of investors. The $70,000 level is a resistance ceiling marking the 2025 cycle high, where significant selling pressure has emerged. These levels have contained price action for weeks, making their breach critical for determining the next trend.
Q2: What happens if Bitcoin breaks below $60,000 support?
A decisive break and daily close below $59,500 could trigger accelerated selling, with the next major support zones located near $55,000 (200-day MA) and $52,000 (previous cycle high from 2024). Such a move would likely cause high leverage long positions to be liquidated, increasing downward pressure.
Q3: What could push Bitcoin above the $70,000 resistance?
A catalyst like a dovish Federal Reserve statement, better-than-expected macroeconomic data, or a surge in spot Bitcoin ETF inflows could provide the momentum. Technically, a weekly close above $70,500 on high volume would confirm a breakout, potentially targeting the $80,000-$85,000 range.
Q4: How does this current situation compare to Bitcoin’s past behavior?
It is similar to consolidation phases seen in Q3 2023 and H1 2021, where Bitcoin traded in a tight range for months before a powerful breakout. The key difference is the presence of constant institutional demand via ETFs, which may provide a stronger support floor than in previous cycles.
Q5: What should a typical investor watch during this period?
Monitor key technical levels ($59,500 and $70,500), Bitcoin exchange netflows (signaling accumulation or distribution), and macro events like CPI reports and Fed meetings. Avoid over-leveraged positions until a clear breakout or breakdown occurs.
Q6: How are Bitcoin miners affected by this price range?
With the current price near many public miners’ estimated production cost, a sustained move below $60,000 could pressure their profitability, potentially forcing some to sell mined coins to cover expenses. This would add sell-side pressure to the market.