Breaking: Bitcoin Price Volatility Surges as Brandt Spots ‘Banana Split’ Pattern, Reserves Hit Unprecedented Low
NEW YORK, March 15, 2026 — The Bitcoin price is exhibiting heightened volatility as two critical technical and on-chain signals converge, suggesting a significant market move may be imminent. Veteran commodity trader and chartist Peter Brandt publicly identified a rare ‘Banana Split’ pattern on Bitcoin’s daily chart this morning, while independent blockchain data from Glassnode confirms that Bitcoin held on centralized exchanges has plunged to its lowest level since 2018. This combination of a classic technical analysis signal with a fundamental supply squeeze on exchanges has captured the attention of institutional and retail traders globally, setting the stage for potential explosive price action in the coming days.
Peter Brandt’s ‘Banana Split’ Pattern Signals Potential Breakout
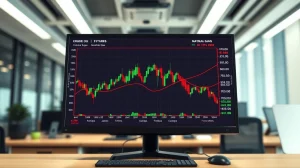
Peter Brandt, a trader with over four decades of experience who accurately called Bitcoin’s parabolic advance in 2017 and its subsequent collapse, posted his analysis to his 800,000 followers on social platform X. The ‘Banana Split’ pattern, a term Brandt coined, describes a specific chart formation following a parabolic advance. It consists of a sharp, parabolic price rise (the banana), followed by a period of consolidation that forms a rounded bottom (the split). Brandt noted that the current Bitcoin chart shows a near-textbook example of this formation completing. “When you see this pattern resolve, it typically precedes a directional move of considerable magnitude,” Brandt stated in his post, though he carefully avoided specifying the direction. Historical instances of this pattern in commodities like silver and coffee have preceded both dramatic rallies and severe corrections, making its appearance a high-convidence volatility indicator rather than a simple bullish or bearish signal.
The pattern’s identification comes after a three-month period where Bitcoin traded within a narrowing range between $85,000 and $95,000, frustrating both bulls and bears. Market analysts at firms like Genesis Trading and Arcane Research have noted a steady decline in spot trading volume during this consolidation, a common precursor to a volatility expansion. The convergence of this technical pattern with critically low exchange liquidity creates a textbook scenario for a sharp price movement, according to several desk notes circulated among hedge funds this afternoon.
Bitcoin Exchange Reserves Plummet to Record Lows
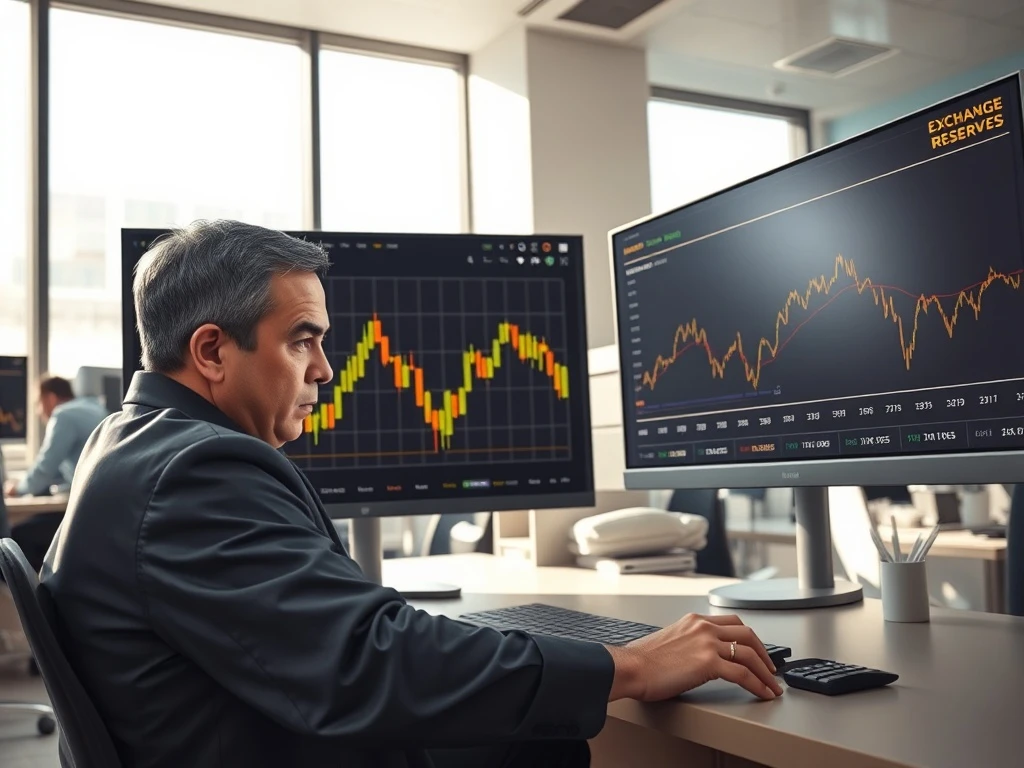
Concurrent with Brandt’s technical observation, on-chain analytics firm Glassnode published its weekly report showing a continued exodus of Bitcoin from centralized exchanges. The total Bitcoin exchange reserves have now fallen below 2.1 million BTC, a level not seen since the early bull market of 2018. This represents a decline of over 35% from the peak reserves held in late 2022. The drawdown has accelerated in the last 30 days, with a net outflow of approximately 120,000 BTC from known exchange wallets. This data is significant because exchange reserves represent the immediately sellable supply of Bitcoin. Lower reserves mean less liquid supply available to meet sell orders, which can amplify upward price movements if new buying demand emerges. Conversely, it can also lead to violent liquidations if leveraged long positions are forced to unwind in a thin market.
Also read: Chainlink (LINK) Whale Activity Surges as Binance Records Staggering $92 Million Outflow
- Supply Shock Catalyst: The shrinking exchange balance coincides with the approaching halving of the Bitcoin mining reward, scheduled for March 2026. The combination of reduced new supply issuance and illiquid existing supply creates a potent fundamental setup.
- Custodial Shift: Analysts attribute the outflow to a continued institutional shift towards self-custody and regulated custodians like Coinbase Custody and Fidelity Digital Assets, driven by evolving regulatory clarity in major markets.
- Options Market Implication: The CME’s Bitcoin options market shows a sharp rise in implied volatility for contracts expiring at the end of March, with traders pricing in a likely price swing of +/- 15% over the next two weeks.
Institutional and Analyst Reactions
Market participants are interpreting the signals with cautious optimism. “The Banana Split is a pattern of recognition, not prediction,” said Marcus Thielen, head of research at crypto analytics firm 10x Research. “It tells us the market has stored energy during consolidation. The direction of the breakout will be determined by macro catalysts, likely the next U.S. CPI print or Fed commentary.” Thielen’s team published a note highlighting that in four of the five previous instances where exchange reserves were this low relative to market cap, Bitcoin’s price increased by an average of 25% over the following 90 days. Separately, a spokesperson for Galaxy Digital pointed to the firm’s quarterly report, which emphasized that long-term holder supply is at an all-time high, suggesting strong conviction among large investors despite the unclear short-term technical picture.
Historical Context and Volatility Comparisons
To understand the potential magnitude of a move, analysts are comparing current metrics to previous periods of low exchange liquidity. The most direct comparison is to early 2021, when reserves fell sharply before Bitcoin embarked on a rally from around $40,000 to its then-all-time high near $65,000. However, the market structure today is profoundly different, with significantly more institutional participation, regulated derivatives, and ETF products. The current volatility, as measured by the 30-day realized volatility index, sits at 45%, which is elevated compared to the 2023 average of 35% but well below the 100%+ readings seen during the March 2020 crash or the November 2021 peak.
| Period | Exchange Reserves (BTC) | 30-Day Realized Volatility | Subsequent 60-Day Price Change |
|---|---|---|---|
| Jan 2021 | 2.4M | 85% | +62% |
| Jun 2022 (Luna Crash) | 2.5M | 105% | -45% |
| Oct 2023 | 2.3M | 32% | +52% |
| Current (Mar 2026) | 2.08M | 45% | ? |
What Traders Are Watching Next
The immediate focus for traders is the $95,000 resistance level and the $85,000 support level that have defined the recent range. A daily close above $95,200 on significant volume would confirm an upside breakout from Brandt’s pattern for many technical traders, potentially triggering a wave of algorithmic buying. Conversely, a break below $84,800 could see accelerated selling as stop-loss orders are triggered. Beyond price levels, on-chain analysts are monitoring the Spent Output Profit Ratio (SOPR), which measures whether coins moved on-chain are being sold at a profit or loss. A sustained SOPR above 1.0 during a breakout would indicate profitable selling is being absorbed, a strong bullish sign. Macroeconomic events, particularly the Federal Open Market Committee (FOMC) meeting scheduled for next week, are also seen as a potential catalyst that could provide the fundamental impetus for the technical pattern to resolve.
Market Sentiment and Derivative Positioning
Despite the ominous-sounding pattern name, derivatives data from Coinglass shows a relatively balanced market. The funding rate for perpetual swaps is slightly positive but not excessively so, indicating modest bullish leverage. The put/call ratio for options is near 0.7, suggesting more traders are positioned for upside than downside, but not at extreme levels that often precede a contrarian “max pain” move. This balanced sentiment, according to several trading desk notes, actually increases the likelihood of a sustained directional move once the pattern breaks, as there is less one-sided positioning to unwind.
Conclusion
The convergence of Peter Brandt’s identified Banana Split pattern and record-low Bitcoin exchange reserves has created a tense and watchful atmosphere in cryptocurrency markets. While the pattern itself does not dictate direction, it strongly suggests that the prolonged period of consolidation is ending. The critically thin liquidity on exchanges means any decisive move could be amplified. Traders and investors should prepare for increased volatility in the coming week, with key technical levels at $95,200 and $84,800 acting as crucial triggers. The ultimate direction will likely be determined by which side—bulls or bears—can muster sufficient force to break the range in a market with historically low immediately available supply.
Frequently Asked Questions
Q1: What exactly is a ‘Banana Split’ pattern in Bitcoin trading?
The ‘Banana Split’ is a chart pattern identified by veteran trader Peter Brandt. It describes a parabolic price rise (the banana) followed by a rounded, consolidative bottoming period (the split). Its completion suggests stored market energy and often precedes a significant directional price move, though the direction is not predetermined by the pattern itself.
Q2: Why are record-low Bitcoin exchange reserves significant for the price?
Exchange reserves represent the liquid supply readily available for trading. When reserves are low, the market becomes more illiquid. This means that a relatively small amount of buying or selling pressure can have an outsized impact on price, potentially leading to sharper and more volatile moves in either direction.
Q3: What are the key price levels traders are watching for a confirmed breakout?
Technical analysts are focused on a daily closing price above $95,200 to confirm a bullish breakout from the current consolidation range, or a daily close below $84,800 to confirm a bearish breakdown. Volume on the breakout will be a critical factor in assessing its sustainability.
Q4: How reliable have Peter Brandt’s past chart pattern calls been for Bitcoin?
Brandt has a mixed but notable track record. He famously called for a parabolic top near $20,000 in late 2017 and identified the subsequent bear market. He also flagged the bullish breakout in late 2020. His analysis is respected for its classical technical foundation, but like all technical analysis, it is probabilistic, not deterministic.
Q5: Does the low exchange reserve trend mean Bitcoin is becoming more scarce?
It means Bitcoin available for immediate trading on centralized venues is becoming more scarce. The overall Bitcoin supply is fixed and known, but the portion held in easily accessible trading accounts is shrinking. This is often interpreted as a sign of long-term holder conviction, as coins move into cold storage or institutional custody.
Q6: How should a typical investor react to this news?
For long-term investors, this may underscore the importance of having a clear risk management strategy and avoiding over-leverage in a potentially volatile period. It is a signal to pay closer attention to market developments but not necessarily a standalone reason to drastically alter a long-term investment thesis based on fundamentals.
This article was produced with AI assistance and reviewed by our editorial team for accuracy and quality.