Bitcoin ETF Inflows Surge: U.S. Spot Funds Snap Seven-Day Outflow Streak with $6.82 Million Net Gain
On January 26, 2025, the U.S. financial markets witnessed a central shift as spot Bitcoin exchange-traded funds (ETFs) recorded their first collective net inflow in seven consecutive trading days. According to definitive data from TraderT, these pioneering funds attracted a net positive flow of $6.82 million, signaling a potential recalibration of investor sentiment toward cryptocurrency exposure through regulated vehicles. This development follows a period of notable outflows that had market observers scrutinizing the endurance of the nascent ETF product class.
Bitcoin ETF Inflows: A Detailed Breakdown of the January 26 Reversal
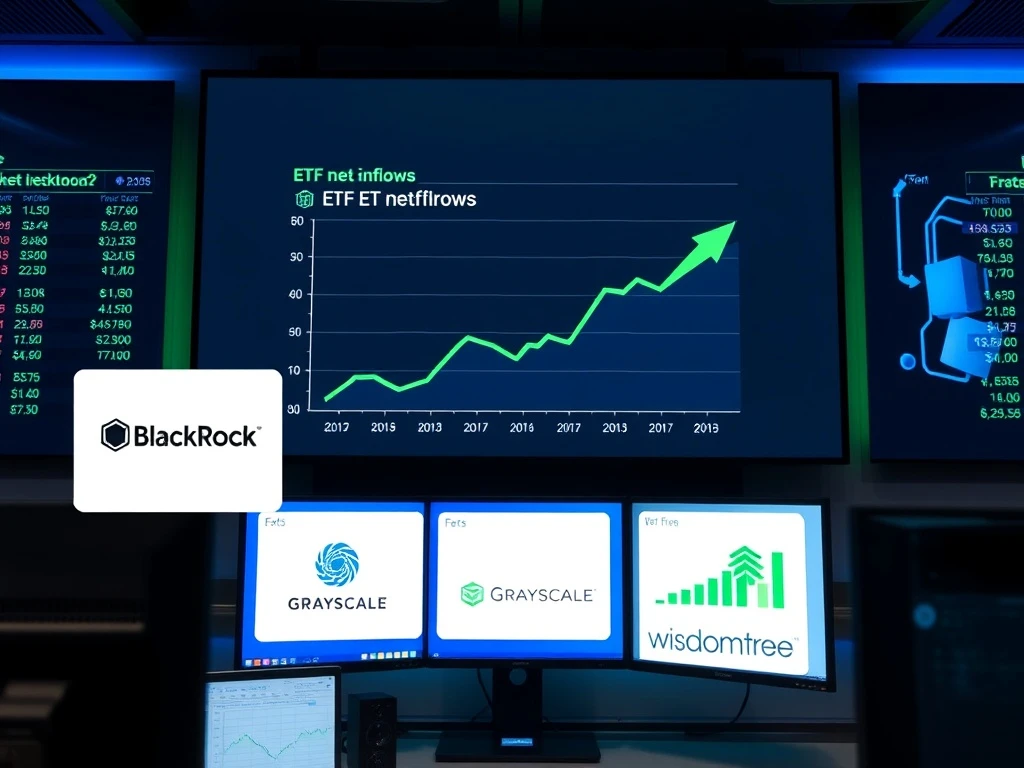
The net inflow figure, while modest, masks significant underlying activity across individual funds. Consequently, the data reveals a story of divergent strategies and investor preferences. Leading the charge was BlackRock’s iShares Bitcoin Trust (IBIT), which secured a substantial inflow of $15.89 million. Simultaneously, Grayscale’s Mini Bitcoin Trust (BTC) attracted $7.75 million, and WisdomTree’s Bitcoin Fund (BTCW) saw a $2.79 million influx. These inflows collectively provided the positive momentum for the sector.
Also read: Bitcoin Strategy Divide: GameStop's 4,710 BTC Hold Contrasts With Nation's Massive Sell-Off
However, the day’s flows were not universally positive. Specifically, several major funds experienced net redemptions. Bitwise Bitcoin ETF (BITB) led the outflows with a withdrawal of $10.97 million. Similarly, Fidelity Wise Origin Bitcoin Fund (FBTC) saw outflows of $5.73 million, and Ark Invest’s ARKB witnessed a $2.91 million reduction. This fund-level divergence highlights the competitive and fluid nature of the spot Bitcoin ETF field, where investors actively allocate between providers based on fees, liquidity, and brand trust.
Contextualizing the Seven-Day Outflow Streak and Market Dynamics
The preceding seven-day outflow period, which this inflow snapped, occurred within a complex macroeconomic environment. Traditionally, ETF flow data serves as a near-real-time barometer of institutional and retail investor sentiment. The streak of outflows beginning in mid-January 2025 coincided with broader market volatility, including fluctuations in traditional equity indices and shifting expectations regarding monetary policy. Analysts often interpret prolonged outflows from a new asset class as a test of its foundational demand.
Also read: Bitcoin Volatility Dips Below Major Stocks as European Nation Sells Billions in Crypto Reserves
Furthermore, the spot Bitcoin ETF market remains in a critical growth phase following its landmark regulatory approval in early 2024. Initial explosive growth naturally transitions into a period of consolidation and price discovery. The recent outflow streak, therefore, represents a standard maturation process for a novel financial product. Importantly, the swift return to net inflows suggests underlying structural demand remains intact, potentially reinforced by long-term allocation strategies from pension funds, endowments, and registered investment advisors.
Expert Analysis on Flow Data and Long-Term Trajectory
Market analysts emphasize that single-day flow data, while informative, must be assessed within a longer-term framework. “A seven-day outflow in a nascent, volatile market segment is not atypical,” notes a senior strategist from a major financial data firm. “The more significant signal is the demonstrated capacity for rapid reversal. This resilience indicates a deep and diverse investor base using these ETFs for various strategic purposes, from tactical trades to multi-year portfolio diversification.”
Evidence from historical ETF launches in other asset classes, such as gold, shows similar patterns of volatile early flows preceding sustained growth. The competitive dynamics are also key. The fact that inflows were concentrated in specific funds like BlackRock’s IBIT points to the importance of scale, brand recognition, and ecosystem integration. Meanwhile, outflows from other funds may reflect routine profit-taking, portfolio rebalancing, or a shift toward lower-fee alternatives, rather than a wholesale rejection of the Bitcoin thesis.
The Structural Impact of ETF Flows on Bitcoin’s Market Structure
The mechanics of spot Bitcoin ETFs create a direct link between fund flows and the underlying asset’s market. Unlike futures-based products, a spot ETF requires the issuer or its authorized participant to purchase actual Bitcoin to back new shares created. Therefore, net inflows translate into direct buying pressure on Bitcoin spot markets. Conversely, outflows force the sale of the underlying asset. This mechanism structurally embeds ETF investor activity into Bitcoin’s price discovery process.
For instance, the aggregate net inflow of $6.82 million on January 26 represented a net buy order for the underlying Bitcoin market. Over the preceding seven days, cumulative net outflows exerted consistent selling pressure. This transparent linkage provides a new, measurable fundamental metric for cryptocurrency analysts. It moves beyond speculative sentiment to track tangible capital movement. Consequently, ETF flow data has rapidly become a key dataset for assessing institutional adoption rhythms and potential support or resistance levels in Bitcoin’s price.
Comparative Performance and the Evolving ETF Field
The variance in performance between funds like IBIT, Grayscale Mini BTC, and BITB offers a case study in market positioning. The following table summarizes key differentiators that may influence flow patterns:
| ETF Ticker | Key Differentiator | Potential Flow Driver |
|---|---|---|
| IBIT | Lowest fee among major issuers; BlackRock’s global distribution | Cost-sensitive long-term holders |
| Mini BTC | Lower share price for granular investment | Retail investors and dollar-cost averaging |
| BITB | Transparent reserve audits and crypto-native branding | Technologically-focused investors |
This competitive sector benefits investors through fee compression and product innovation. The flow data suggests the market is still determining winners, with capital moving dynamically between options. This activity is a hallmark of a healthy, competitive financial marketplace rather than a sign of weakness.
Conclusion
The return to net inflows for U.S. spot Bitcoin ETFs on January 26, 2025, marks a meaningful inflection point after a week of outflows. This event underscores the dynamic and evolving nature of cryptocurrency investment through regulated channels. While daily fluctuations will continue, the underlying trend points toward gradual institutional integration. The Bitcoin ETF ecosystem is demonstrating resilience, providing investors with a critical tool for exposure, and fundamentally altering the market structure of the flagship digital asset. Monitoring these flows remains essential for understanding the maturation of cryptocurrency within the global financial system.
FAQs
Q1: What does “net inflow” mean for a Bitcoin ETF?
A1: A net inflow occurs when the total value of money invested into an ETF through new share purchases exceeds the value redeemed through share sales on a given day. For a spot Bitcoin ETF, this typically requires the issuer to buy more Bitcoin to back the new shares.
Q2: Why did some Bitcoin ETFs have inflows while others had outflows on the same day?
A2: This is common in competitive ETF markets. Investors may move capital between funds based on factors like management fees, perceived liquidity, the issuer’s reputation, or specific investment strategies. It indicates active choice rather than blanket selling.
Q3: How significant is a $6.82 million net inflow in the context of total Bitcoin ETF assets?
A3: While the absolute amount is small relative to the tens of billions in total assets under management (AUM), the symbolic importance is greater. It represents a break in a negative trend and can signal a shift in short-term sentiment, which often precedes larger moves.
Q4: Do ETF flows directly cause Bitcoin’s price to move?
A4: For spot Bitcoin ETFs, there is a direct mechanical link. Net inflows force the purchase of physical Bitcoin by the issuer, creating buying pressure. Net outflows force sales, creating selling pressure. This makes flows a relevant, though not sole, factor in price discovery.
Q5: What was the main cause of the prior seven-day outflow streak?
A5: Pinpointing a single cause is difficult. Outflows likely resulted from a combination of normal profit-taking after a price rally, broader financial market volatility, and portfolio rebalancing by early investors. Such consolidation phases are typical after the initial launch surge of a new financial product.
This article was produced with AI assistance and reviewed by our editorial team for accuracy and quality.