Bitcoin Surges Past $72K, Setting Stage for Potential $80M Short Squeeze
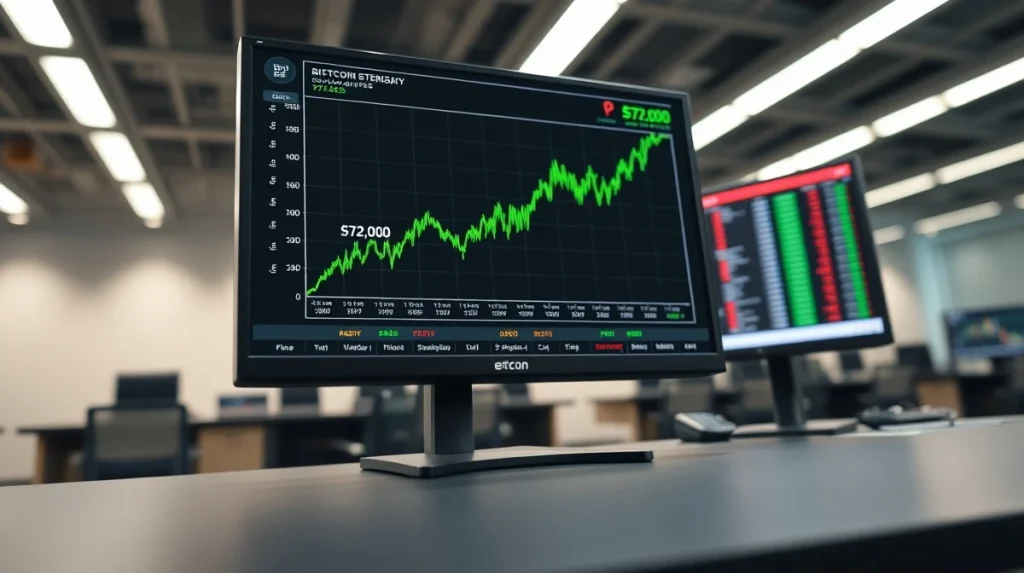
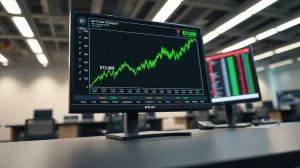
Bitcoin surged past the $72,000 mark on April 11, 2026, as a swift recovery placed mounting pressure on bearish traders. The world’s largest cryptocurrency traded near $73,100, eyeing a critical liquidity zone that analysts say could trigger a cascade of forced buying. Market data reveals a cluster of sell orders just above $75,300, representing a potential $80 million risk for short positions. This price action suggests traders are bracing for volatility.
Bitcoin Price Recovery and Liquidity Pressure
After a period of consolidation, Bitcoin’s price staged a steady climb. Data from CoinGlass shows the aggregate value of short positions facing liquidation near the $75,300 level has grown to approximately $80 million. When a short position is liquidated, the exchange automatically buys back the asset to close the trade. This creates a wave of buy-side pressure. A concentrated cluster of these liquidations can amplify price moves rapidly.
Also read: Securitize TRON Integration Signals Major Expansion for Tokenized Asset Access
“The market is testing higher levels,” said a report from crypto analytics firm Kaiko. “Liquidity on the sell side above $75K is thin, which means any sustained buying pressure could move the price quickly through that area.” This scenario is often called a short squeeze. It forces traders who bet on lower prices to exit their positions by buying Bitcoin, inadvertently pushing the price higher.
Technical Indicators Signal Growing Momentum
Key technical metrics support the narrative of building upward momentum. The Relative Strength Index (RSI), a gauge of whether an asset is overbought or oversold, hovered near 61 for Bitcoin. An RSI above 50 typically indicates bullish momentum, but below 70 suggests room for further gains before being considered overbought.
Also read: Chainlink Unlocks Vital S&P Stablecoin Ratings Onchain in Major Finance Bridge
More notably, the Moving Average Convergence Divergence (MACD) indicator—which tracks trend changes and momentum—remained in a bullish configuration. The MACD line was above its signal line, a classic buy signal watched by chart analysts. This combination of indicators points to strengthening buyer control, at least in the short term.
Market Structure and Trader Sentiment
Beyond the charts, derivatives markets provide context. According to data from Coinglass, the funding rate for Bitcoin perpetual swaps—a fee paid between long and short traders to keep the contract price aligned with the spot market—remained positive. This indicates that traders holding long positions are paying a premium to those holding shorts, reflecting a bullish but not excessively speculative sentiment.
However, open interest, or the total number of outstanding derivative contracts, has increased alongside the price rise. This suggests new money is entering the market. When price and open interest rise together, it is generally interpreted as new long positions being established, reinforcing the trend. The implication is that the rally is being supported by fresh capital, not just short covering.
Historical Context of Crypto Short Squeezes
Short squeezes are not uncommon in cryptocurrency markets, which are known for high employ and volatility. A notable example occurred in early 2021. Bitcoin’s price rocketed from around $30,000 to over $40,000 in just a few days, a move largely attributed to a massive short squeeze that liquidated billions in bearish bets across exchanges.
The current setup differs in scale but follows a similar pattern. What this means for investors is heightened potential for sharp, unpredictable moves. A successful breach of the $75,300 liquidity wall could see Bitcoin test its all-time high near $74,800 from March 2024 swiftly. Conversely, failure to hold gains could trigger long liquidations on the way down.
Broader Market Conditions and Catalysts
Bitcoin’s move occurs against a mixed macroeconomic backdrop. Recent U.S. inflation data has led markets to adjust expectations for Federal Reserve interest rate cuts. Traditionally, higher-for-longer rates pressure risk assets like tech stocks and crypto. Yet, Bitcoin has shown resilience, decoupling from equities at times.
Some industry watchers note that institutional flows via spot Bitcoin exchange-traded funds (ETFs) approved in early 2024 have created a new base of demand. According to Farside Investors data, these U.S. spot ETFs have seen net positive inflows for much of the past month. This steady institutional buying can absorb selling pressure that might otherwise cap rallies.
Risk Factors and Trader Caution
While the setup appears bullish, risks abound. The same liquidity data that points to a potential short squeeze also shows significant long liquidations clustered below the current price. A sudden downturn could trigger these, leading to a sharp correction. Furthermore, the overall crypto market capitalization remains below its 2021 peak, indicating that the rally is not yet broad-based.
Analysts at trading firm QCP Capital noted in a recent market update that volatility expectations, as measured by derivatives, have risen. “The market is pricing in bigger swings,” they wrote. This suggests professional traders are preparing for significant moves in either direction, not a one-way trip higher.
Conclusion
Bitcoin’s reclaim of the $72,000 level sets a tense stage for the coming sessions. With $80 million in short positions at risk near $75,300 and technical indicators favoring bulls, the conditions for a short squeeze are present. Market structure shows new capital supporting the move, but historical volatility warns of potential reversals. Traders are now watching whether Bitcoin can gather enough momentum to breach the key liquidity wall and challenge previous highs, or if it will succumb to the gravitational pull of long liquidations below. The next few days will test the strength of this recovery.
FAQs
Q1: What is a short squeeze in cryptocurrency trading?
A short squeeze happens when the price of an asset rises rapidly, forcing traders who borrowed and sold it (shorted) expecting a price drop to buy it back to limit their losses. This wave of buying can push the price even higher.
Q2: How much in Bitcoin short positions is currently at risk?
Data from April 11, 2026, shows approximately $80 million worth of Bitcoin short positions face potential liquidation if the price rallies to around $75,300.
Q3: What do the RSI and MACD indicators tell us about Bitcoin’s current trend?
The RSI near 61 suggests bullish momentum without being overbought. A bullish MACD configuration, where the MACD line is above its signal line, indicates strengthening upward momentum and positive trend alignment.
Q4: Could this price move be related to Bitcoin ETFs?
Yes. Sustained net inflows into U.S. spot Bitcoin ETFs create consistent institutional buying demand. This can provide underlying support for prices and contribute to upward pressure, especially when combined with technical factors like a short squeeze setup.
Q5: What are the main risks if the short squeeze does not happen?
The primary risk is a price reversal. If Bitcoin fails to break above the $75,300 resistance, it could fall back toward support levels. This could trigger the liquidation of over-leveraged long positions, causing a sharp downward move.
This article was produced with AI assistance and reviewed by our editorial team for accuracy and quality.