Aptos Price Analysis: Downtrend Deepens but Essential Relief Bounce Remains Possible
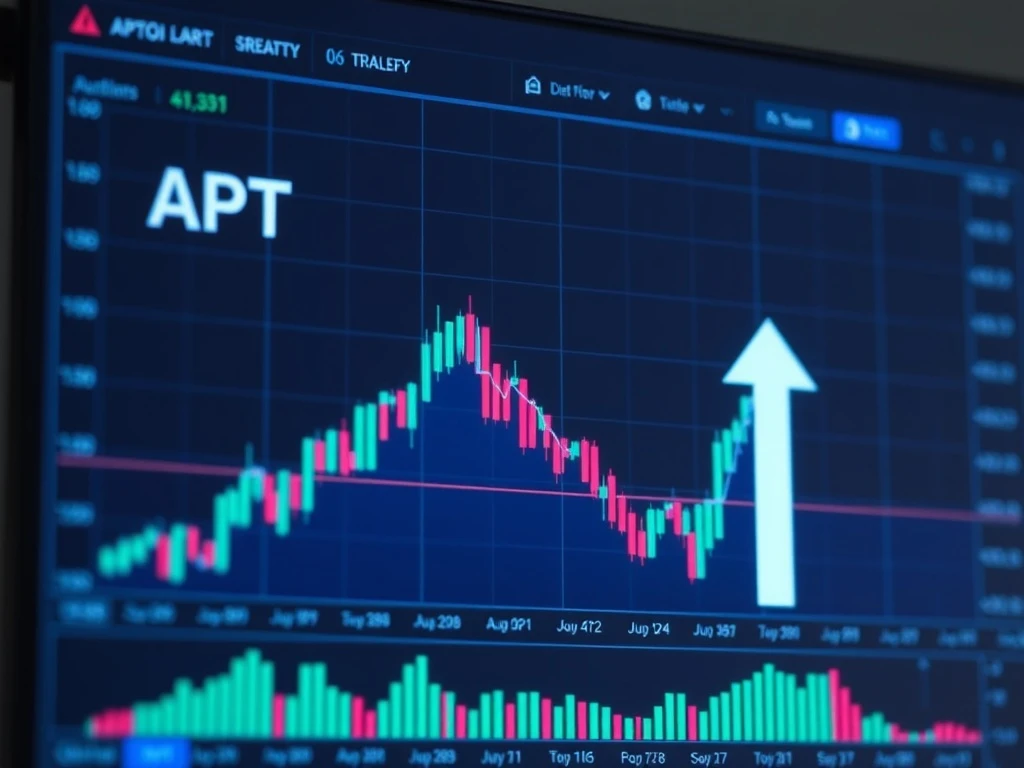
On February 2, 2026, Aptos (APT) reached a concerning new all-time low of $1.14, extending a prolonged bearish trend that has dominated its price action throughout 2025. The token experienced a significant 8.55% single-day decline, intensifying pressure on holders and traders. Despite this persistent downward momentum, detailed technical analysis of liquidation maps and four-hour price charts reveals a potential pathway for a short-term relief bounce. This analysis examines the complex interplay between market structure, on-chain metrics, and trader positioning that could temporarily reverse APT’s fortunes before further declines.
Aptos Price Technical Structure and Bearish Momentum
The Aptos price chart reveals a consistently bearish structure since June 2025, when the critical $4.32 support level decisively broke. This breakdown established a clear downward trajectory that has persisted for months. Subsequently, the 23.6% Fibonacci extension level at $1.72 transformed from a potential support zone into a confirmed resistance area, demonstrating the strength of selling pressure.
Technical indicators further confirm the bearish dominance. The 20-period moving average has consistently acted as dynamic resistance, effectively capturing the downward momentum’s intensity. Meanwhile, the Chaikin Money Flow (CMF) indicator has remained below -0.05 for over two consecutive months. This prolonged negative reading signals substantial capital outflows from the APT market, as investors systematically reduce their exposure.
Market analysts note that such extended periods of negative CMF readings typically precede further price deterioration. The absence of significant buying pressure creates an environment where even minor sell orders can trigger disproportionate downward movements. Consequently, the technical outlook suggests additional losses remain highly probable in the medium term, despite potential short-term reversals.
Also read: SUI Price Tests Critical $1.05 Level as Pepeto's Stunning 300x Surge Captures Market Attention
The Comparative Market: Aptos Versus Sui
Beyond pure price action, fundamental metrics highlight Aptos’s competitive challenges within the Move programming language ecosystem. Throughout late 2025 and into 2026, Sui (SUI) has consistently outperformed Aptos in several critical areas. Most notably, Sui maintains approximately double the monthly active developer count compared to Aptos, indicating stronger ecosystem growth and innovation potential.
Furthermore, Sui demonstrates a significant advantage in Total Value Locked (TVL), a key metric measuring decentralized finance adoption and utility. This TVL disparity suggests that despite sharing technological foundations, Sui has captured greater developer mindshare and user adoption. The divergence in these fundamental metrics provides key context for understanding APT’s price struggles, as ecosystem vitality increasingly influences token valuation in competitive blockchain environments.
Liquidation Analysis and Short-Term Bounce Potential
Despite the overwhelmingly bearish longer-term structure, liquidation data reveals potential for a temporary price recovery. Analysis of liquidation heatmaps from platforms like CoinGlass shows an interesting imbalance in nearby utilize positions. Specifically, the cumulative value of short liquidation levels significantly outweighs nearby long liquidation clusters in the $1.50-$1.55 price range.
This tap into distribution creates conditions where a modest price increase could trigger cascading short liquidations. As short positions face forced buying to cover losses, this buying pressure could amplify upward movement. Market mechanics suggest this dynamic could propel APT toward the $1.50-$1.55 resistance zone, even amid broader bearish sentiment.
The timing of such a bounce remains uncertain, however. Market participants should monitor four-hour chart developments closely, as the most recent downward impulse provides clear Fibonacci retracement levels. The $1.44 and $1.52 levels represent particularly significant areas, as they align precisely with high-density short liquidation clusters identified in liquidation maps.
Trading Implications and Strategic Considerations
For active traders, this technical setup presents specific strategic opportunities. The alignment between Fibonacci retracement levels and liquidation clusters creates identifiable risk-reward scenarios. Traders anticipating a relief bounce might consider the $1.44-$1.52 zone as a potential selling area, given its confluence of technical resistance and liquidation triggers.
Risk management remains paramount in such volatile conditions. Position sizing should account for the possibility that the anticipated bounce may not materialize or could prove weaker than projected. Setting clear entry and exit parameters based on the identified technical levels can help traders work through this uncertain environment systematically.
Longer-term investors face different considerations. The persistent downtrend and fundamental challenges suggest continued caution is warranted. While temporary bounces may offer portfolio rebalancing opportunities, the broader trend indicates that sustained recovery would require significant shifts in both technical structure and fundamental metrics.
Market Context and Broader Cryptocurrency Environment
Aptos’s price action occurs within a complex broader cryptocurrency market. Throughout early 2026, several major assets have experienced increased volatility and corrective movements. This market-wide context influences APT’s price dynamics, as correlated movements and shifting capital allocations affect all digital assets.
Regulatory developments, macroeconomic factors, and institutional adoption trends all contribute to the environment in which Aptos operates. Traders analyzing APT must consider these external factors alongside technical indicators. The interplay between project-specific fundamentals and broader market sentiment creates the multifaceted market that determines price trajectories.
Historical patterns suggest that assets establishing new all-time lows often face extended periods of consolidation or further decline before establishing sustainable recovery. The psychological impact of repeatedly breached support levels can create persistent selling pressure, as discouraged holders gradually exit positions. This dynamic frequently requires substantial time or catalyzing events to reverse.
Conclusion
Aptos (APT) continues working through a challenging bearish trend that has pushed the token to new all-time lows. Technical analysis confirms the downtrend’s strength while simultaneously identifying potential for a relief bounce toward the $1.50-$1.55 range. This contradictory outlook reflects the complex interplay between persistent selling pressure and short-term liquidation dynamics. Traders should approach any potential bounce with appropriate risk management, recognizing it may represent a temporary reprieve rather than trend reversal. The Aptos price trajectory will ultimately depend on both technical developments and fundamental improvements in ecosystem metrics relative to competitors like Sui.
FAQs
Q1: What caused Aptos (APT) to reach new all-time lows?
The Aptos price decline results from multiple factors including persistent bearish market structure since June 2025, capital outflows indicated by negative CMF readings, and competitive challenges within the Move ecosystem where Sui has gained developer and adoption advantages.
Q2: How high could a potential APT relief bounce reach?
Technical analysis suggests a relief bounce could target the $1.50-$1.55 price range. This projection combines Fibonacci retracement levels from recent downward movements with liquidation map data showing significant short positions in this zone.
Q3: What is the significance of liquidation maps in this analysis?
Liquidation maps reveal concentrations of leveraged positions that could trigger forced buying or selling. The current map shows more short positions than long positions near current prices, creating conditions where a price increase could accelerate through short covering.
Q4: How does Sui’s performance relate to Aptos’s price decline?
Sui has outperformed Aptos in key metrics including developer activity and Total Value Locked. This comparative weakness may contribute to APT’s price struggles as investors allocate capital to perceived stronger projects within the same technological niche.
Q5: What should traders watch for regarding APT’s price movement?
Traders should monitor whether APT can establish support above $1.14 and observe price action around the $1.44-$1.52 resistance zone. Additionally, changes in trading volume and CMF readings could indicate shifting momentum that might alter the current technical outlook.
This article was produced with AI assistance and reviewed by our editorial team for accuracy and quality.